
.jpg)
War is hell, and it’s also inflationary. That’s why the attack on Iran has led bond yields (and mortgage rates) to jump. The market is particularly worried about the impact of energy prices on US inflation. And the Fed will be less likely to cut rates if a prolonged war sends CPI higher. The good news is that mortgage rates are (so far) still in the low 6% range.
War & rates. The US/Israel attack on Iran led to an immediate spike in oil prices (+$12/barrel), 10-year US Treasury yields (back above 4%), and average 30-year mortgage rates (back above 6%). The rapid expansion of the conflict to include most Gulf states (UAE, Kuwait, Qatar, Bahrain, Saudi Arabia, etc.), and the grave threat posed to fuel tankers passing through the Strait of Hormuz, increased the risk of a prolonged, and highly inflationary, war.
TP: War is typically (and reliably) inflationary. There are a few reasons for this.
- #1: Warring states must spend a lot of money (weapons, equipment, fuel, personnel etc.) to support the campaign. Rising demand + Largely-fixed supply = Inflation.
- #2: One of the primary aims of combatants is to decimate their opponents’ productive capacity (bases, factories, roads, ports). Stable demand + Much-reduced supply = Inflation.
- #3: If the conflict disturbs or destroys the normal production and transportation of key fuels (oil, natural gas), global supply will drop and global fuel prices will rise. And fuel prices are typically a large part of most countries’ CPI baskets.
- #4: To the extent that warring states must finance their war efforts with additional borrowing, that is also inflationary. The USA has a national debt of nearly $40 trillion, and it grows each year (because we can’t even deliver a balanced budget). Increased demand for money = higher price of money (i.e., higher interest rates). You have to pay people more to get them to buy your debt.
So what does this mean for us, I mean the USA? #1 and #2 aren’t likely to affect inflation much because we already spend a lot on our military and the war is geographically far away. But #3 is a big one - something like 25% of the world’s oil & gas supply comes from Gulf countries - and we’re seeing higher fuel prices already. And #4 just adds to the concerns that the USA could be barrelling towards a national debt crisis.
Based on the above, how do you think the Fed will act? That’s right, it makes them more hawkish (less likely to cut rates, more likely to pause or raise rates) because of war-driven inflation fears. Here’s what Minneapolis Fed President, Neel Kashkari, had to say just a few days ago:
“Before Iran, it seemed like things were gently heading in the right direction. [When Russia invaded Ukraine] I was on ‘Team Transitory.’ [Inflation] was transitory. It was just much higher than we expected and much longer than we expected. Do we really want to do another ‘Transitory 2.0’?”
In other words, many Fed members will use the war as a (fairly reasonable) justification for doing nothing when it comes to rates.
But it all depends on how long the war lasts. A short conflict could see fuel prices drop back to their pre-war levels very quickly. Whereas a prolonged conflict could cause a step-up in inflation levels, mostly from “Energy” costs but a host of other product categories are also affected directly or indirectly by fuel prices.
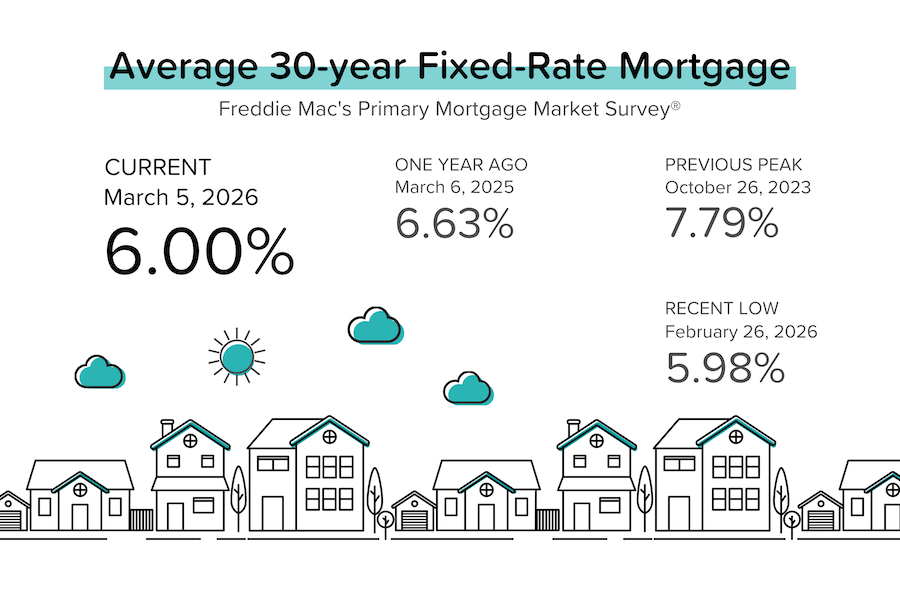
Mortgage rates remained in the low 6% range. The good news is that average 30-year mortgage rates have been relatively well-behaved, rising from just 5.98% to a high of 6.13%. That’s still not far from 3-year lows. This is a critical time for the residential housing market, with new listings ramping up in advance of the spring selling season. [Mortgage News Daily]
Home price growth is stabilizing. In January 2026, national home price growth slowed to just 0.7% year-over-year according to Cotality, with the Northeast & Midwest outperforming the South & West. Interestingly, Cotality still maintains a forecast for >4% price growth over the next 12 months. [Cotality]
TP: As I mentioned last week, I’m seeing the same trend in the Case-Shiller data, where only 1 of the 20 big city indexes posted a month-over-month decline in December 2025, vs. 16 back in July 2025!
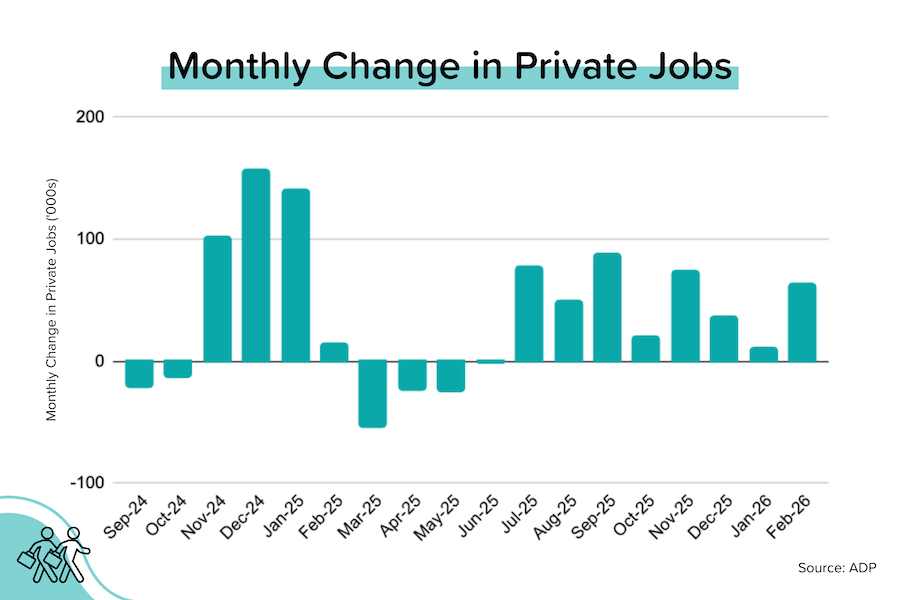
ADP: jobs growth stayed weak. In February, private employers added 66,000 net jobs, and the January figure was halved from +22,000 → +11,000. So job growth rose, but it’s still pretty close to zero. Additionally, the wage growth premium between changing jobs and staying put narrowed to just 1.7%, the lowest premium seen in many years.
Bond and Mortgage Market
According to Freddie Mac’s weekly PMMS survey, average 30-year mortgage rates only moved up slightly this week - to 6.00%. But due to the timing of survey responses, this does not appear to fully capture the sharp upward move in Treasury and Mortgage Backed Securities’ yields in response to the US/Israel-Iran war. Mortgage News Daily is currently showing an average 30-year mortgage rate of 6.13%.
Expectations of near-term Fed rate cuts were already low before the Iran attack. Now they’re even lower.
Note: The Fed Funds Rate policy range is currently 3.50-3.75%. The probabilities below come from the CME Group website and are implied from the Fed Funds Rate futures market.
- March 18 FOMC Meeting: 97% probability that the Fed Funds Rate target range is kept at 3.50-3.75% (was 96% a week ago). In other words, no rate cut at the March FOMC meetings.
- April 29 FOMC Meeting: 87% probability that the Fed Funds Rate target range is kept at 3.50-3.75% (was 82% last week). In other words, no rate cut at EITHER the March or April FOMC meetings. 13% probability that rates will be 25 basis points below current (was 17% last week), which would imply a 25 bps rate at the April meeting.
- June 17 FOMC Meeting: 67% probability that the Fed Funds rate will be kept at 3.50-3.75%. So no Fed rate cut for three straight FOMC meetings. Only a 29% probability of a 25 basis point rate cut at this meeting.
Inspiration
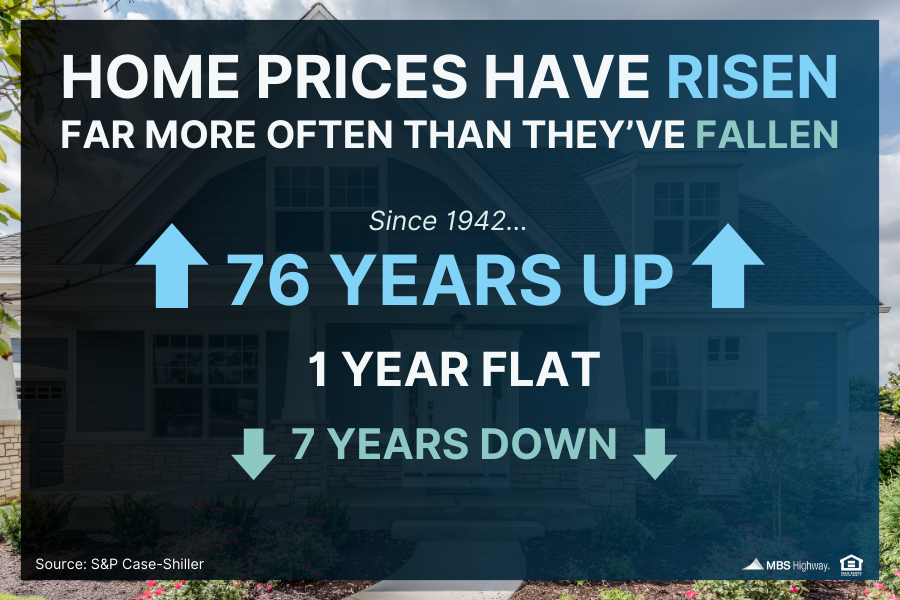
I shared this data last week, but thought you’d appreciate seeing the graphic. In 2025, the Case-Shiller national home price index rose 1.3%. Not terribly exciting, right? But keep in mind that home prices have risen by 55% over the last 6 years! It’s very common for high growth periods to be followed by slower growth periods - whether you’re talking about home prices or stock prices. But home price growth still remained positive in 2025. In fact, since 1942, home prices have increased 76 times, been flat once, and fell only 7 times. That’s a helluva record!
They Said It
“Overall, January’s data confirms that price fluctuations are stabilizing. After a steady climb throughout 2025, the number of metros experiencing year-over-year price drops has plateaued, with one third of the nation’s top 100 metropolitan areas recording year-over-year declines in both December and January.” - Selma Hepp, Cotality's Chief Economist
Related posts
FAQ: Why can home prices stay high even when mortgage rates rise?

.jpg)
Weekend Talking Points - '6 7'
.png)
Housing Mixed, Fed Divided on Next Steps
Ready to close more deals?
ListReports automatically delivers personalized marketing collateral to your inbox helping you engage with your customers and prospects.