
MBS Highway Housing Index, July 2026
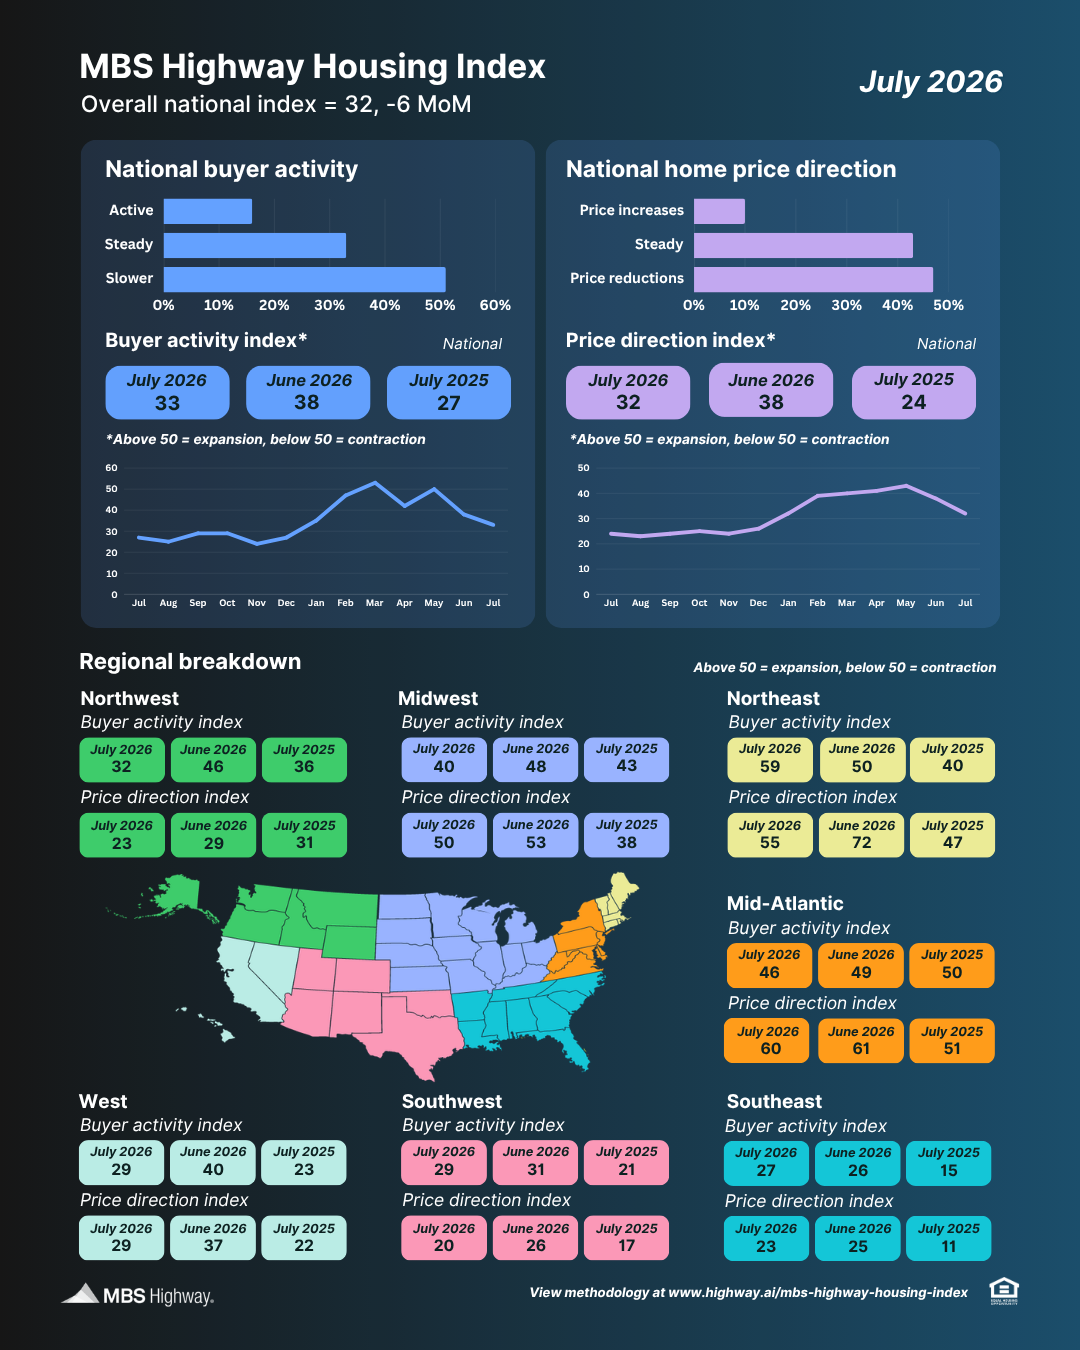
After reaching a seasonal high of 47 in May, the MBS Highway National Housing Index continued to cool in July 2026, falling from 38 in June to 32. Buyer activity and home price direction both posted notable month-over-month declines.
National Data
The MBS Highway National Housing Index fell sharply for the second consecutive month in July, declining 6 points from June to 32. Even with the recent slowdown, the index remains 6 points higher than it was one year ago. As a reminder, readings above 50 indicate expansion, while readings below 50 signal contraction.
Buyer activity also weakened, dropping 5 points to 33 in July. Despite the monthly decline, the index is still 6 points above its reading of 27 a year ago. Nationwide, just 16% of respondents described buyer activity as active, down from 22% in June and 32% in May. This suggests buyers continue to be highly sensitive to interest rates, a trend that became more evident earlier this spring.
After climbing for six straight months, the price direction index declined for the second month in a row, falling 6 points to 32. The index remains well below the 50 mark, indicating that price reductions continue to outpace price increases across the country.
Regional Data
Buyer activity declined in five of the seven regions, with the steepest drops occurring in the West (down 11 points to 29) and the Midwest (down 8 points to 40). The Northeast was the only region to remain in expansion territory, climbing 9 points to 59.
Price direction weakened across all seven regions. While three regions saw relatively modest declines of 1 to 3 points, the Northeast experienced a notable 17-point drop (from 72 to 55), followed by the West with an 8-point decline (from 37 to 29). Even after these pullbacks, the Mid-Atlantic (60), Northeast (55), and Midwest (50) remained at or above the 50 expansion threshold.
Question of the Month
Many homeowners continue to feel "locked in" by the low mortgage rates they secured in recent years. Still, major life events – such as getting married, growing a family, or accepting a new job – can eventually make moving unavoidable. This month, we asked respondents whether the mortgage rate lock-in effect in their local market is:
• About the same (still strong)
• Somewhat diminished
• Greatly diminished
Nearly half of respondents (47%) said the lock-in effect remains strong, while another 48% said it has somewhat diminished. Just 5% felt it has greatly diminished. For comparison, when we asked the same question in July 2025, 53% said the lock-in effect was still strong, 44% said it was somewhat diminished, and 3% said it had greatly diminished.
Regionally, respondents in the Northeast (73%), Midwest (60%) and Mid-Atlantic (59%) were the most likely to say the lock-in effect remains strong. Responses in the remaining regions were more closely aligned with the national averages.
Methodology
MBS Highway’s monthly Housing Index provides an accurate and real-time read on buyer activity and home price direction both nationally and regionally in the U.S. housing market. This survey of 30,000 mortgage and real estate professionals fills a crucial industry need for insights that reflect buyers’ immediate experiences, helping mortgage loan originators to better serve homebuyers.
The MBS Highway Housing Survey is comprised of two separate component indices: buyer activity and home price direction. Each month, respondents rank buyer activity as “active,” “steady,” or “slower,” and home price direction as “price increases,” “steady,” or “price reductions.” A national and regional index is calculated for each component index by applying the formula “[active + (steady/2)]” for buyer activity, and “[price increases + (steady/2)]” for home price direction. The score for each component index is then used to calculate the MBS Highway Housing Index by applying the formula "[(national buyer activity/2) + (national home price direction/2)].
Any number over 50 indicates expansion while a number below 50 indicates contraction. The MBS Highway Housing Index can range between 0 and 100.
Dan Habib, MBS Highway’s Chief Revenue Officer, explained, “There are a few reliable housing reports available in the market, most of which are delayed by two months. Because MBS Highway has a large base of mortgage and real estate clients, we felt we were in a unique position to capture real-time housing data from our subscribers, who are on the front lines of the housing market.”