
After a massive drop in July 2025, the MBS Highway National Housing Index edged lower in August 2025, slipping by 2 points to a level of 24. Elevated mortgage rates continue to strain affordability and dampen demand, while softening price momentum is now evident across most regions, with only the Northeast and Mid-Atlantic showing modest resilience.
National Data
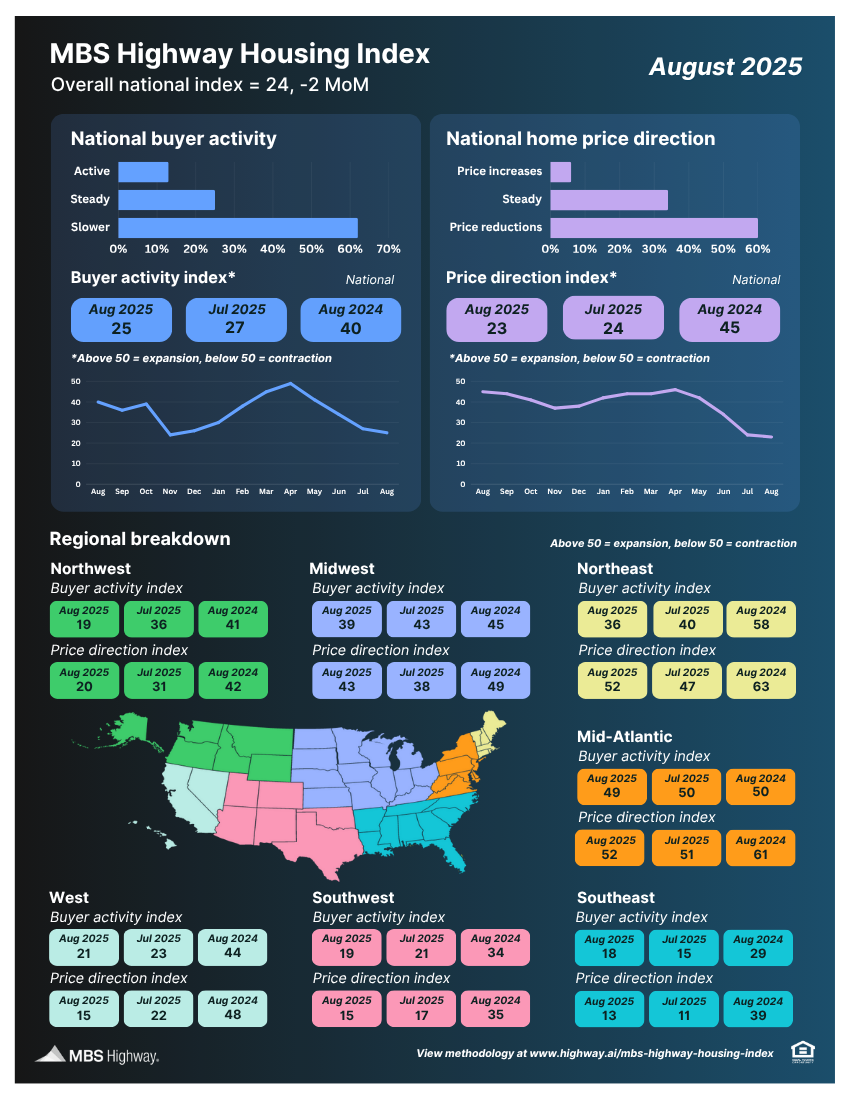
After plunging 8 points in July 2025, the MBS Highway National Housing Index dropped a further 2 points in August 2025 to 24. This is the lowest index level we’ve seen since January 2023, when home prices were briefly trending downward in the wake of the Fed’s rapid tightening cycle.
As a reminder, an index reading of 50 serves as the dividing line between contraction (below 50) and expansion (above 50). The overall index has not exceeded 50 since June 2024, when it last reached 53.
Buyer activity dropped 2 points to 25, down sharply from 40 a year ago. Well more than half of respondents nationwide (62%) described current buyer activity as slow.
Price direction slipped by 1 point to 23, compared to 45 in August 2024, reflecting weaker price momentum nationwide. A full 60% of respondents nationwide indicated that they were seeing price reductions in their local markets.
Regional Data
In August 2025, buyer activity was mixed but generally weak across the seven regions, with the largest declines seen in the Northwest (-17 points to 19) and the Northeast (-4 points to 36). The slowest regions for buyer activity were the Southeast (+3 to 18) and the Southwest (-2 to 19). Only the Mid-Atlantic (-1 to 49) came close to the breakeven threshold of 50.
Price direction was flat to down in most regions, with just the Northeast (+5 to 52) and Mid-Atlantic (+1 to 52) remaining in expansion territory. The largest declines in price direction were in the Northwest (-11 to 20) and West (-7 to 15). The regions seeing the most pricing pressure were the Southeast (+2 to 13), Southwest (-2 to 15) and now, the West.
Question of the Month
Are you in a buyer’s or seller’s market? We asked the same question in March 2025. Not surprisingly, the pendulum has swung towards a buyer’s market in many states, with 55% of all respondents feeling that they were operating in a ‘buyer’s market’ (vs. 32% in March). Only 16% of respondents said that they were in a ‘seller’s market’ (vs. 36% in March), and the remaining 28% considered their market ‘balanced’.
Buyer’s Markets: Mississippi (100% of respondents said ‘Buyer’s market’), Washington D.C. (100%), Arizona (91%), Tennessee (87%), Florida (83%), Arkansas (80%), Colorado (80%), Oklahoma (75%), Utah (75%), and Texas (72%).
Seller’s Markets: Alaska (100% of respondents said ‘Seller’s market’), Connecticut (100%), Rhode Island (100%), Pennsylvania (77%), New Jersey (75%), Massachusetts (60%), Michigan (58%), Wisconsin (57%), Maryland (57%), and Illinois (53%).
Related posts

FAQ: Do I need a home inspection for a new construction home?

.png)
Inflation Eases, Housing Faces Headwinds

FAQ: Can I use gift funds for my down payment?
Ready to close more deals?
ListReports automatically delivers personalized marketing collateral to your inbox helping you engage with your customers and prospects.