
The MBS Highway National Housing Index fell 3 points in November 2025 to 24. A year ago, the index stood at 31. While average mortgage rates are significantly lower than they were a year ago, inventory levels are much higher, putting downward pressure on prices.
National Data
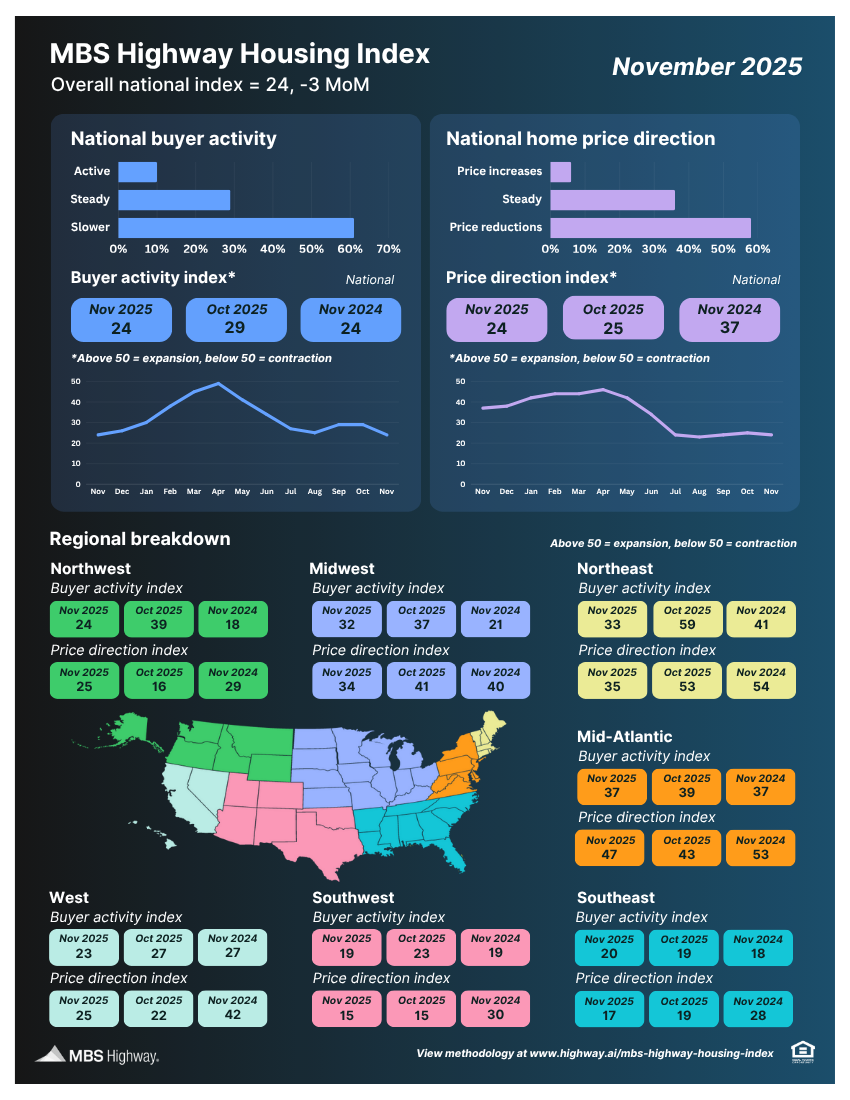
The MBS Highway National Housing Index declined 3 points in November 2025 to 24. A year ago, the overall index was higher at 31, despite average mortgage rates being ~75 basis points higher than they are today. The difference is inventory levels, which are 15–20% higher than they were a year ago, putting downward pressure on prices.
As a reminder, an index reading of 50 serves as the dividing line between contraction (below 50) and expansion (above 50). The overall index has been in contraction territory since June 2024, when it hit 53.
Buyer activity fell 5 points to 24, matching the level from a year ago. This represents a notable deceleration after October’s relative stability. 61% of respondents nationwide described current buyer activity as slow. The downtrend in mortgage rates is not yet bringing buyers off the sidelines.
Price direction declined 1 point to 24, down significantly from 37 in November 2024. This reflects continued inventory rebuild and weakening pricing power across many markets. 58% of respondents nationwide indicated that they were seeing price reductions in their local markets.
Regional Data
In November 2025, six out of seven regions saw declines in buyer activity, with only the Southeast seeing a slight rise (from a very low level). The sharpest drops came from the Northeast (-26 to 33) and the Northwest (-15 to 24). The Southwest (19) and Southeast (20) continue to see the most subdued buyer activity.
Price direction was low, but more mixed, with three regions declining, three modestly improving, and one flat. The Northeast saw the largest decrease (-18 to 53), while the Mid-Atlantic bucked the trend with a 4-point gain to 47, making it the only region approaching neutral territory on pricing. Again, the Southwest and Southeast remain the weakest regions.
Question of the Month
Have you seen an increase in the cancellation rate in your area? Several national media sources have recently noted a rising percentage of homes falling out of contract. We asked respondents if, in terms of the cancellation rate, they were seeing:
- About the same,
- Higher than normal, or
- Lower than normal?
Overall 65% of respondents said that they saw nothing unusual in terms of the cancellation rate. However, just over 1-in-4 (26%) said that cancellation rates were higher than normal, particularly in the Southeast (32% of respondents from that region said ‘higher than normal’).
Related posts

FAQ: Can I use gift funds for my down payment?

.jpg)
July 2026 MBS Highway Housing Index
.png)
Home Sales Slip, Prices Show Strength
Ready to close more deals?
ListReports automatically delivers personalized marketing collateral to your inbox helping you engage with your customers and prospects.