
.jpg)
The shocking July BLS jobs report changed everything. The market is now fully expecting a rate cut in September, and average mortgage rates dropped to near 6.5%. Affordability is improving!
Shocking BLS jobs numbers for July. This report changed everything. The US added just 73K jobs in July (well below estimates), and the unemployment rate ticked up from 4.1% to 4.2% (very nearly 4.3% btw). That was weak, but not terrible.
What was shocking were the revisions: the previously reported figures for May and June were revised down by a total of 258K jobs! As a result, the new May number was +19K (from +139K initially reported) and the new June number was +14K (from +147K initially reported). That’s basically no growth in employment over the last quarter. [BLS]
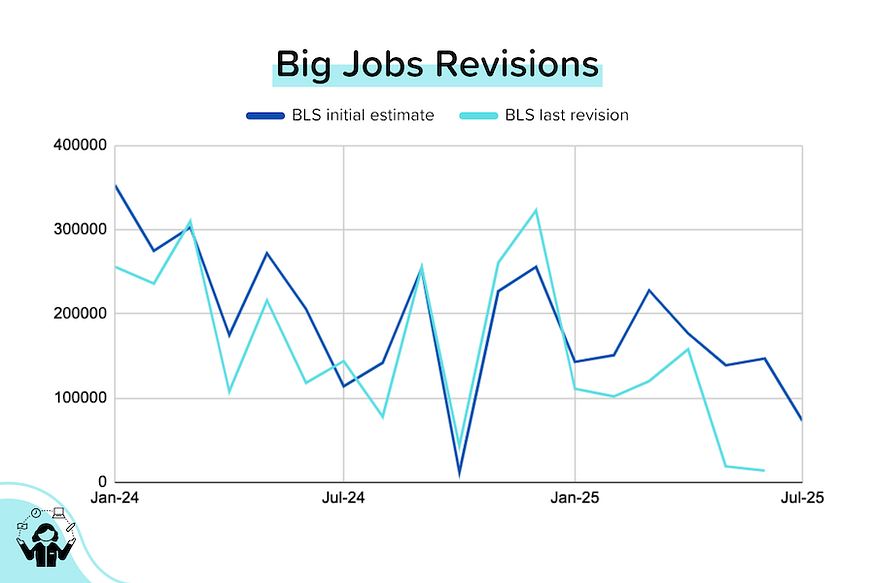
TP: We’ve been talking about these consistently large, and usually negative, revisions for some time. In 2025, the average monthly revision has been approximately -77K jobs. These are big numbers! Would the Fed have made the same decision on July 31 if it had known that the real numbers for monthly jobs growth were so low? I don’t think so.
Trump fired BLS head. In response to the above report, President Trump fired BLS Commissioner Erika McEntarfer, claiming that the BLS was tampering with the data for political reasons. Personally, I don’t think that’s a legitimate accusation. The BLS is a huge machine, with an established and complex process for arriving at these numbers. The revision process is also well-established (advance, preliminary, final).
TP: As a reminder, the BLS prepares both the monthly jobs report AND the CPI report. These are two of the most important datapoints the Fed looks at when determining interest rate policy. So they need to be as accurate as possible. [Much more on this later.]
Federal Reserve Governor resigned. Adriana Kugler is on the Board of Governors of the Federal Reserve system. That means that she always gets to vote on monetary policy. Her term was scheduled to end on January 31, 2026. Instead, she’ll exit on August 8, 2025. That means that President Trump will get to appoint her replacement. Since a new Fed Chair MUST be an existing Governor, it’s possible that President Trump could use this opportunity to bring in Powell’s eventual replacement (Powell’s term ends on May 15, 2026). [Federal Reserve]
TP: The Federal Open Markets Committee (“FOMC”) has 19 members, 12 of whom vote. Of the 12, 7 are on the Board of Governors (they always get a vote). The New York Fed President also always gets a vote. The remaining 4 votes come from the other regional Fed Presidents on a rotating basis.
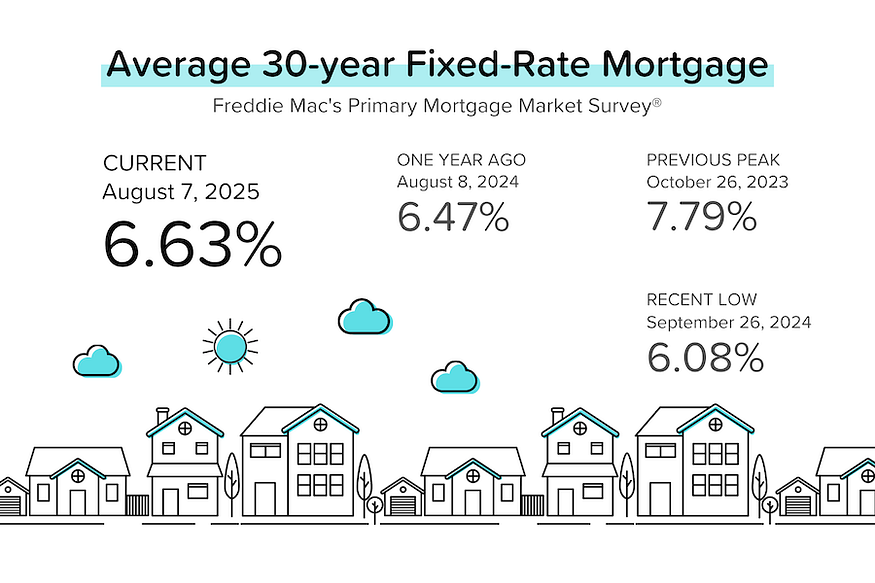
Mortgage rates dropped. For the first time in a while, the bond market actually reacted to the BLS jobs revisions. This, combined with Kugler’s resignation, significantly increased the chances of a rate cut at the next Fed meeting on September 17. Think about it: the new BLS data provides ample evidence of a slowing job market, and the addition of a third Trump appointee will (almost certainly) increase the number of dovish (favoring rate cuts) FMOC members. Average 30-year mortgage rates dropped as low as 6.57%, the lowest level of the year. [Mortgage News Daily, Freddie Mac PMMS]
TP: The week before the June PCE data came out, the probability of a rate cut on September 17 was 61%. After the PCE came out (which showed an acceleration in inflation), the probability of a rate cut plunged to 39%. And how about the probability of a rate cut in September after the BLS jobs report and Kugler resignation came out? A very confident 93%!!!
The number of homes for sale keeps rising, but it’s not distributed evenly. Active inventory (excludes homes already under contract) rose 25% year-over-year in July, but that’s still 11% below July 2019 (pre-pandemic) levels. Dig a little deeper, and a clear regional divide emerges: Some Southern and Mountain states now have inventory levels 30% above pre-pandemic norms, while parts of the Northeast and Midwest remain 40–60% below. [Realtor.com]
TP: Property is a local market. The local supply and demand for homes is much more important than national statistics. I’m seeing a very clear correlation between the state-by-state level of inventory and the direction of home prices. [More on this later.]
Home price growth is really slowing. Cotality (previously CoreLogic) reported that national home prices rose just 0.1% in June. That’s the slowest price growth for that month since 2008! On a year-over-year basis, price growth slowed to just 1.7%. But interestingly, Cotality is maintaining its forecast for 4.2% price growth over the next 12 months. Obviously, they’re expecting mortgage rates to fall. Let’s hope they’re right. [Cotality]
Some Thoughts on the BLS
Over the last year, I’ve read 20 books on inflation, employment, data-collection methods, the statistics that report them, and their inherent biases and time lags. I’ve also been fortunate to join MBS Highway’s prep call for their daily morning update video.
The first thing I’d say is that the BLS’ job is very, very difficult. The US has a huge, diverse and fast-changing economy. Workers are very mobile. Technology has dramatically changed where we shop and what we buy. But the BLS must keep pace with these changes, because the numbers it produces (jobs report, CPI, etc.) are so important:
- Fed’s interest rate policy: The Fed’s dual mandate is to keep inflation under control and maintain full employment. BLS data is key to the Fed’s decision making process. And the Federal Funds Rate is unquestionably the world’s most important price. All other prices — not just US treasury yields and mortgage rates, but even stocks — take their cues from and are influenced by the Fed Funds Rate.
- Endowments: The annual Cost of Living Adjustment (COLA) for Social Security payments feeds from CPI. If the CPI is overstated, our annual deficit gets even worse. Other social assistance programs have similar COLA adjustments.
- Collective bargaining agreements: Many negotiated wage agreements include annual salary increases that reference the annual CPI increase.
- Taxes: The IRS references CPI to adjust tax brackets to prevent “bracket creep” — where people move into higher tax brackets because inflation has lifted wages on a nominal basis, even though their real (inflation-adjusted) wages haven’t changed. The standard deduction and gift/estate tax exemptions are also inflation-adjusted.
- Utility prices: Many regulated utilities (electricity, gas etc.) will regularly ask for rate increases based on inflation (CPI) rates.
- Rental rates: Many longer-term rental agreements include an annual rate increase that is directly or indirectly indexed to inflation.
And that’s not an exhaustive list. Pretty important stuff, right?
The second thing I’d like to say is that there are many well-known issues with BLS data that should be addressed:
- Jobs Report: Falling survey response rates, large (and usually) downward revisions to the initial jobs growth estimate, birth/death model adds jobs that don’t exist (especially at economic turning points), much later (and again usually downward) revisions coming from the QCEW report. Possible solutions: 1) Make the survey mandatory, 2) Let the first estimate anticipate the downward revisions, 3) Delay the release of the first estimate until greater confidence is achieved.
- CPI Report: The weighting given to Shelter is far too high (44% of “core” CPI) and most of that comes from Owner’s Equivalent Rent (a price that no homeowner actually pays), the data collection process for Shelter introduces massive time lags, known biases (buyer substitution, outlet substitution, quality change, new products) skew the CPI higher than it should be. More recently, BLS staff cuts have resulted in a higher number of prices being guessed rather than directly observed. Possible solutions: 1) Change the Shelter (especially OER) ratings and create (or pay for) a more current series, 2) Make weighting changes more frequently, 3) collect much more pricing data digitally, 4) spend more money and hire more people.
The BLS’ job is hard, but it’s critically important, which is why it must swiftly address market changes and known issues.
A State-by-State Look at Inventory
I probably sound like a broken record at this point, but it’s really important to understand that when national prices are up ~2% year-over-year, that means some cities are seeing +5–8% price increases while others are seeing 0–5% price falls. Currently, national active inventory is up 25% year-over-year, but 30% of that active inventory is in Florida and Texas! In general, it’s the states where active inventory is well above (>20%) pre-pandemic levels that are seeing price declines. While states where active inventory is still well below (-40% or more) pre-pandemic levels that are still generating high single-digit price growth.
To illustrate that, I put together the following graphic using the July 2025 and July 2019 data from Realtor.com’s Residential Listing Database. As you can see, only a handful of states have inventory levels that are Red level (>20% above pre-pandemic), but some of these happen to be the largest property markets: Texas, Florida, Washington, and Arizona. They’re concentrated in the South and Mountain regions.
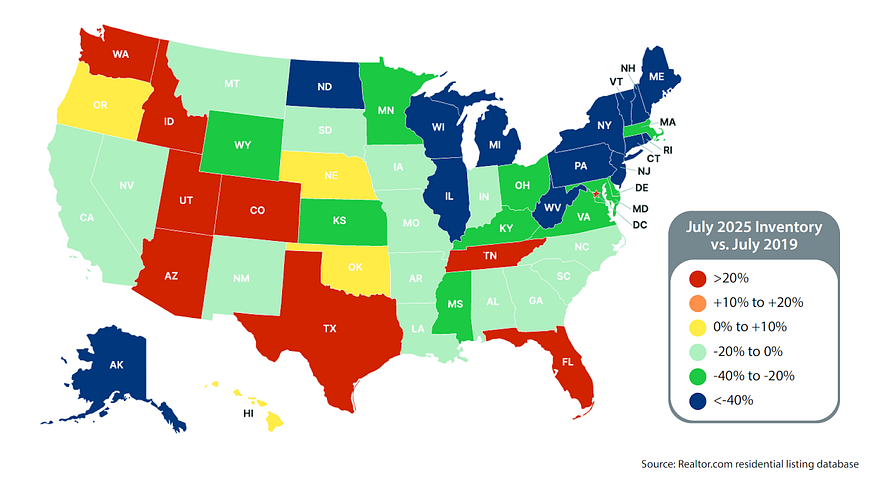
In contrast, most of the Blue and Green level states (active inventory at least 20% below pre-pandemic) are concentrated in the Northeast and Midwest regions.
Bond and Mortgage Market
What a change a week can make! The futures market has gone from pricing in 1–2 rate cuts before year end to 2–3. So that’s 50–75 bps of rate cuts likely. Over the course of last week, average 30-year mortgage rates dropped from 6.75% to as low as 6.57% (-18 bps). I expect to see a chunky rise in refi volumes when we get the next MBA data.
Here’s what the Fed Funds Rate futures market is currently pricing in for rate cuts:
Note: The current Fed Funds Rate policy range is 4.25–4.50%.
- September 17 FOMC Meeting: A 93% probability that rates will be 25 bps below current (up from just 39% a week ago)! 7% probability that rates will remain at 4.25–4.50%.
- October 29 FOMC Meeting: 64% probability that rates will be 50 bps below current (up from 15% a week ago). That implies a 25 bps cut at both the September 17 and October 29 meetings.
- December 10 FOMC Meeting: 52% probability that rates will be 75 bps below current, 40% probability that they will be 50 bps below current.
They Said It
“It’s always difficult when you’re at a point where [the economy] may be changing and then you add to that the fact that staffing has been constrained and the agencies haven’t had the resources to invest in following up with respondents the way they might have in the past.” — Katherine Abraham, Former BLS Commissioner (1993–2001)
Related posts
.png)
Inflation Below Forecasts, Home Sales Rise

.jpg)
Weekend Talking Points - 'Treat'
.png)
Home Builder Confidence Hits 6-Month High
Ready to close more deals?
ListReports automatically delivers personalized marketing collateral to your inbox helping you engage with your customers and prospects.