
.jpg)
The Fed cut short-term interest rates for the 3rd time in 2025, admitted that the BLS jobs numbers were probably “overstated,” and announced the resumption of short-term asset purchases — all good news for bond yields (and by extension, mortgage rates).
“Core” PCE moved lower in September. This really was the big one. If we could get a ‘tame’ PCE report, the path would be relatively clear for the Fed to cut rates. While “headline” annual PCE did climb to +2.8% YoY in September (from +2.7% in August), “core” PCE [the Fed’s preferred inflation gauge] moved in the opposite direction (+2.9% YoY → +2.8% YoY).
TP: Importantly, “shelter” costs (rent + owner’s equivalent rent) rose just 0.15% month-over-month (or +3.7% YoY).
MBS Highway Housing Survey results. In December, the MBS Highway National Housing Index recovered the 3 points it had lost in November to reach 27. A year ago, the overall index was 5 points higher at 32, despite average mortgage rates being ~50 basis points higher than they are today!
TP: That said, we typically see the index start its seasonal upswing in January — and lower rates/improved affordability should give that a boost.
Job openings JOLTed the market. We got the September (7,658,000 job openings) and October (7,670,000) data all at once. Because the increase in September (+431,000) was the largest we’ve seen in years, it initially shocked the market — could this derail the Fed rate cut? But the Hires Rate (3.2%) was tied for a decade low, and the Quits Rate (1.8%) was the lowest seen since May 2020.
TP: Actual jobs are more important than job openings, and the Hires & Quits rates still suggest a very cautious labor market — where employers are reluctant to hire OR fire, and employees lack the confidence (or monetary incentives) to jump ship.
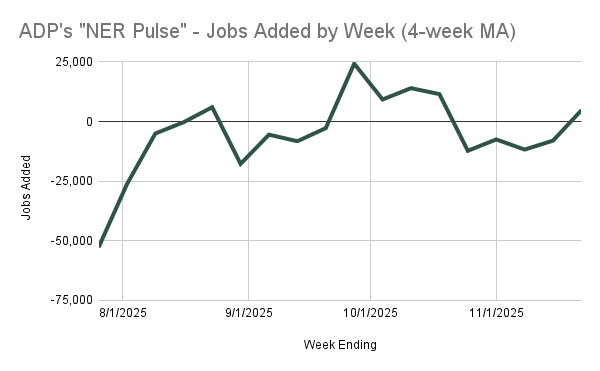
Weekly ADP “NER Pulse” shows improvement. ADP reported that the average weekly private job gains (for the month ended November 22) was 4,750, a big improvement from -8,000/week previously. This suggests that ADP’s monthly jobs number for November will likely swing positive, but remain modest.
Fed cut rates for the 3rd time in 2025. Three voters dissented (two wanted no cut, one wanted -50 bps). Overall, Fed members concluded that the downside risks to employment were greater than the upside risks to inflation. The new target range for the Federal Funds Rate is 3.50%-3.75% — that’s 175 basis points (1.75%) below where the Fed Funds Rate peaked in 2024 (5.25%).
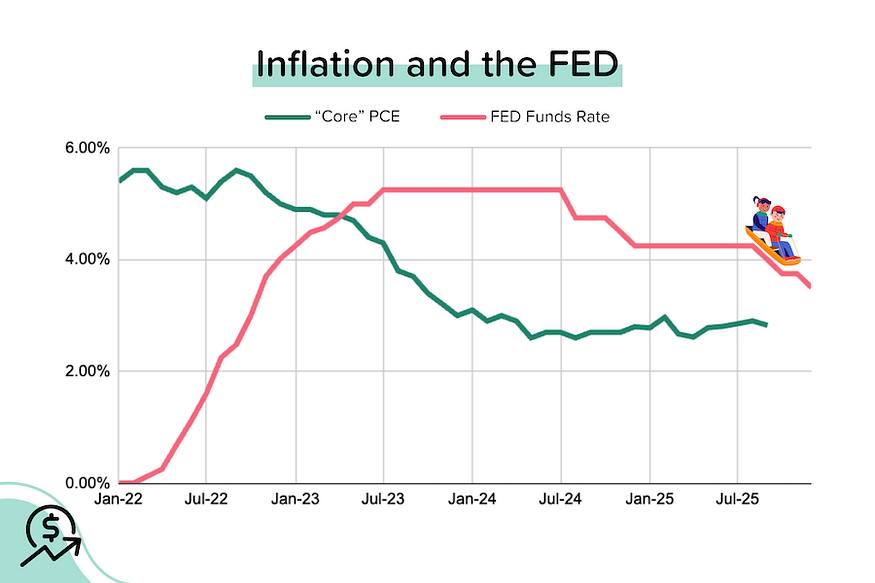
Importantly, the Fed also announced that it would start buying short-term Treasuries (initial target $40B/month) in order to keep bank reserve balances “ample” and keep the Fed Funds Rate within the target range. That should be positive for treasury yields and, by extension, mortgage rates.
TP: Unless something dramatic happens in the next 45 days, the Fed will probably do nothing at the January 28 meeting. The Fed Funds Rate futures market is currently pricing in just a 24% probability of a rate cut at that meeting.
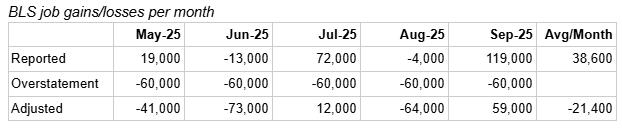
Powell admits that the BLS jobs numbers are likely “overstated”. This was quite extraordinary: the Fed Chair said that he believes problems related to the birth/death model likely result in the BLS jobs numbers being overstated by about 60,000/month. Since May, the reported jobs growth has averaged +40,000/month. Taking out the overstatement would swing that to -20,000/month!
Latest housing data from Realtor.com
In November 2025, total active inventory (which excludes homes under contract) rose +13% YoY to 1.07 million units. That’s a significant deceleration from +31% YoY in April 2025. Despite this slowdown, active inventory is now just 6% below pre-pandemic levels (November 2019). Nationwide median listing prices, meanwhile, were basically flat (-0.4% YoY) at $415K.

But that masks significant variation at the state and metro level:
State-level Observations
- Half (24) of the states and districts are seeing (generally modest) year-over-year declines in their median listing prices. Prices are down 7.1% YoY in D.C., 5.9% YoY in Hawaii, 4.5% in Massachusetts, and 4.1% YoY in Arizona.
- 19 of the states and districts have active inventory levels (Nov 2025) that are above pre-pandemic (Nov 2019) levels. D.C.’s inventory is an incredible 74% above pre-pandemic levels; Arizona’s +39%, and Tennessee’s +37%.
Metro-level Observations:
Keep in mind: the Top 100 cities (by number of households) have 66% of the nation’s active inventory. The Top 200 cities have 80% of the nation’s active inventory.
- The total active inventory for the Top 100 cities in November 2025 was 10% below pre-pandemic levels (October 2019). The total active inventory for the next 100 cities (101–200) was 7% below pre-pandemic levels.
- In November 2025, 52% of the Top 100 metros had median listing prices that were down year-over-year (was 54% last month), with a median decline of around 2.1%. Looking at the next 100 cities, 53% had a YoY decline with a median drop of 2.5%.
- The biggest YoY declines in listing prices among the major metros were seen in Toledo OH (-9.1%), Erie PA (-8.1%), Charleston SC (-7.7%), Cape Coral-Ft Myers (-7.0%), Columbus GA (-6.8%), New Orleans LA (-6.4%), San Diego CA (-5.7%), San Francisco (-5.6%), and Honolulu (-5.6%)
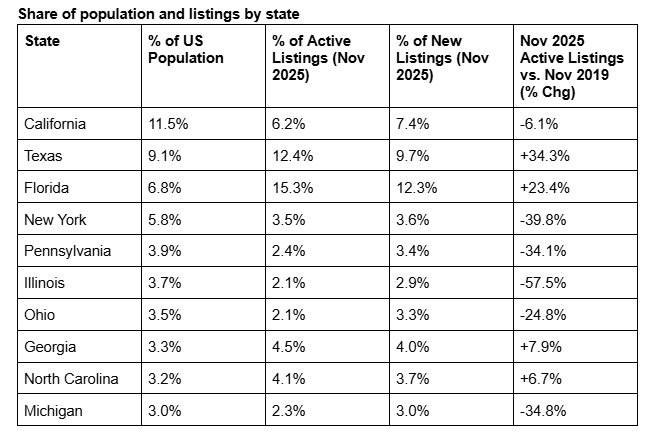
Inventory Levels for the 10 Largest States by Population
Relative to their population, Florida and Texas continue to over-index for listings, while California significantly under-indexes. Florida has twice the listing share you’d expect given its population share, while California has half the listing share you expect given its population share.
(!!!) Texas has twice as many active listings (131,869) as California does (66,283), despite having only 78% of California’s population! And Florida has 2.5X as many active listings (163,059) as California, despite having 59% of California’s population.
There are currently 19 states with inventory levels (November 2025) that are ABOVE their pre-pandemic levels (November 2019). There were 18 in October, and 16 in September. Most of the states with inventory levels that are well above pre-pandemic levels are in the South or Mountain West.
19 States where Inventory Levels (Nov 2025) are ABOVE Pre-Pandemic Levels (Nov 2019)
District of Columbia: +74.4%
Arizona: +39.1%
Tennessee: +37.0%
Texas: +34.3%
Utah: +29.4%
Colorado: +29.4%
Washington: +24.8%
Florida: +23.4%
Idaho: +18.4%
Oklahoma: +14.0%
Georgia: +7.9%
Nebraska: +7.6%
North Carolina: +6.7%
Alabama: +6.3%
Nevada: +5.0%
Arkansas: +4.7%
Oregon: +4.4%
Hawaii: +2.3%
South Carolina: 0.9%
And as you’d expect, the states seeing the largest price declines are also generally the states with the highest inventory levels relative to pre-pandemic: D.C., Arizona, Utah, and Colorado, etc.
24 States where Listing Prices are Falling YoY (Nov 2025 vs. Nov 2024)
District of Columbia: -7.1% YoY
Hawaii: -5.9% YoY
Massachusetts: -4.5% YoY
Arizona: -4.1% YoY
Iowa: -3.5% YoY
California: -3.2% YoY
Utah: -2.7% YoY
Colorado: -2.4% YoY
Nebraska: -2.3% YoY
New Jersey: -3.9% YoY
Texas: -2.2% YoY
South Dakota: -2.1% YoY
Not shown: FL, GA, IL, KS, ME, MN, NT, NV, NJ, ND, OR, TN, WY (all declining, but <2% YoY).
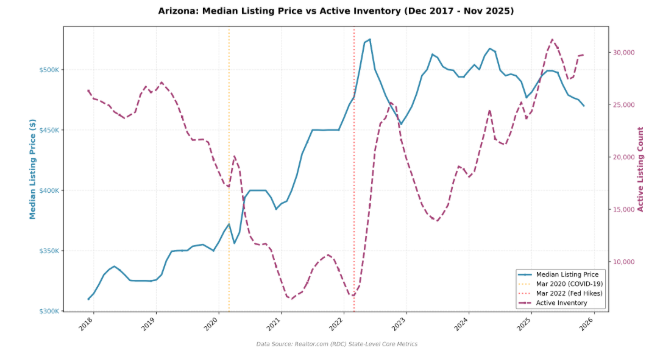
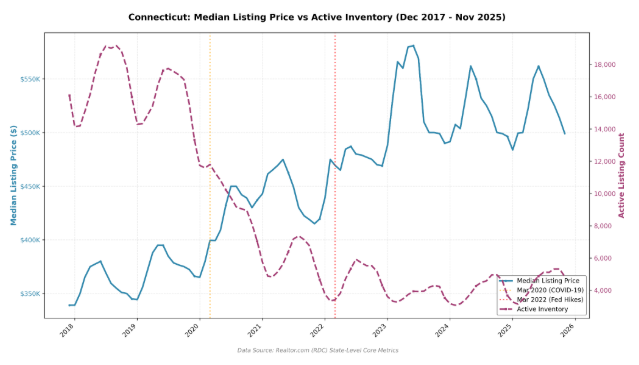
State-level, dual-axis charts really tell the story
I love these charts. You can see the huge drawdown in inventory with the onset of COVID-19, the rebound in inventory as the Fed began raising rates to combat inflation, and the slowdown in price growth as that happened. Each state is different, of course, but these charts really help you understand when and why prices have reacted.
TP: I’ve got updated Price vs. Inventory charts for every state and D.C. ready to go. Just ask! (scott@highway.ai).
Arizona’s active inventory is 39% above pre-pandemic levels
Connecticut’s active inventory is 69% below pre-pandemic levels
Bond and Mortgage Market
Fed week is always interesting. This one was particularly volatile. We had the tame PCE report, followed by the somewhat concerning (for the bond market) JOLTs report. Expectations were building for another “hawkish cut” — where the Fed cuts rates, but then pours water on future cuts. Instead, Powell’s commentary was almost dovish!
Net result: Yields on the 10-year UST are back near 4.1%, and average 30-year mortgage rates stand at 6.22%, according to Freddie Mac’s weekly PMMS survey.
Note: After the rate cut on Oct 29, the Fed Funds Rate policy range is now 3.50–3.75%. The probabilities below come from the CME Group website and are implied from the Fed Funds Rate futures market.
- January 28 FOMC Meeting: 76% probability that the Fed does nothing; only a 24% probability of a 25 bps rate cut.
- March 18 FOMC Meeting: 51% probability that the Fed Funds Rate target range is kept at 3.50–3.75%. In other words, no cut at either the January or March FOMC meetings. 41% probability that rates will be 25 bps below current levels, which implies a rate cut at either January or March meetings, but not at both.
They Said It
A series of quotes from Jerome Powell, Federal Reserve Chairman, after the decision to cut rates on December 10:
- “We think there’s an overstatement in these [BLS jobs] numbers…It’s a complicated, unusual, and difficult situation, where the labor market is also under pressure, where job creation may actually be negative.”
- Regarding the January 2026 FOMC meeting: “I could make a case for either side. [We’ll have to] wait and see how the economy evolves…I don’t think a rate hike [in January[ is anyone’s base case at this point.”
- “I would note that having reduced our policy rate by 75 basis points since September and 175 basis points since last September, the Fed Funds Rate is now within a broad range of estimates of its neutral value.” [Neutral value here means the rate at which inflation doesn’t accelerate and the unemployment rate doesn’t surge.]
Related posts

Home Sales Rise While Economic Growth Slows


Weekend Talking Points – ‘Spike’

March 2026 MBS Highway Housing Index
Ready to close more deals?
ListReports automatically delivers personalized marketing collateral to your inbox helping you engage with your customers and prospects.