
.jpg)
They did it again! After two weeks of very bond-friendly data, the BLS jobs report for January was a slap in the face: much larger-than-expected job gains and a drop in the unemployment rate. It’s really unbelievable. And I mean in both senses of the word.
January housing data was typically seasonal. New listings rose 41% month-over-month as sellers newly listed (or relisted) properties to get ready for the spring selling season. (In January 2025, new listings were up a similar 38% MoM.) Total active inventory was up 10% year-over-year to 912,696 units. The median listing price was roughly flat at $399,900. More on this later. [Realtor.com]

TP: Over the next three months, new listings should continue to ramp up as transaction volumes rise through spring. Let’s pray that average 30-yr mortgage rates stay in the low 6% range.
Surprisingly weak holiday season sales. Retail sales for December were flat month-over-month, well below Wall Street expectations of +0.4% MoM. That means that annual sales growth slowed to 2.4% year-over-year. Are consumers rising debt levels finally starting to crimp their shopping impulses? [Commerce Department]
ADP: Very little job growth. For the four weeks ending 1/24/26, private employers added an average of 6,500 jobs per week. That’s ~26,000/month, fairly similar to the January monthly figure (+22,000) released by ADP last week. [ADP]
TP: As a reminder, ADP only looks at private (non-government) job growth.
MBS Highway Housing Index surged. The MBS Highway National Housing Index jumped in February 2026, rising 9 points from January to 43. A year ago, the index stood at 41. Lower mortgage rates and improved affordability are boosting the normal seasonal upswing.
TP: An index reading of 50 separates contraction (<50) from expansion (>50). Should mortgage rates remain in the low 6% range (or move even lower into the high 5% range), we should see the overall index move into expansion territory for the first time in 20 months.
BLS: They did it again! The big BLS jobs report for January showed that the US added 130,000 jobs in January 2026, and that the unemployment rate dropped from 4.4% in December 2025 to 4.3%. On the surface, this was a very strong report. Job gains were more than 2x what the market was expecting. Moreover, +130K is the biggest job growth we’ve seen since December 2024!

But wait, there are a few things I’d like to point out:
- A year ago, the advance estimate for January 2025 came out at +143K. This was revised down to +125K, and then to +111K. And after QCEW-related revisions, the final-final number was revised down to -48K! +143K → -48K! Incredibile!
- QCEW-driven revisions to the full-year 2025 jobs data shaved off 403K jobs from the total. And that’s on top of the 641K in total downward revisions that happened over the course of 2025
- So the actual job growth in 2025 ended up being 1.04 million jobs lower than was initially reported. That’s roughly 87K in total downward revisions per month.
- After all the revisions, the 181K total jobs added over the course of 2025 was the lowest since 2003 outside of recessions. And yet GDP growth is currently running at ~4% YoY?
TP: After such a great run of bond-friendly data, I was really starting to believe that this could be the week that average 30-yr mortgage rates dropped into the high 5% range. Sadly, no. That said, the bond market seems to be taking the BLS report relatively well. We certainly weren’t alone in pointing out the dark side of these ‘blowout’ numbers.
Latest Housing Data from Realtor.com
In January 2026, total active inventory (which excludes homes under contract) rose +10% YoY to 913K units. That’s a massive deceleration in inventory growth from +31% YoY in April 2025.
The normal winter drop in inventory was very pronounced in 2025. As a result, active inventory is now 18% below pre-pandemic levels (January 2019), having been within 5–6% earlier in the year. Nationwide median listing prices, meanwhile, were basically flat (-0.2% YoY) at $400K.
But the charts above mask significant variation at the state and metro level:
State-level Observations
- More than half (31) of the states and districts are seeing year-over-year declines in their median listing prices. Prices are -7.7% YoY in D.C., -6.8% YoY in Hawaii and -6.7% in Wyoming.
- States with highest YoY increase in median listing prices were Ohio +6.0% YoY, Rhode Island +5.6% YoY, Arkansas +3.8% YoY and Virginia +3.7% YoY.
- In January 2026, only 10 states and districts had active inventory levels that were above pre-pandemic (January 2019) levels. D.C.’s inventory is an incredible 66% above pre-pandemic levels, Texas +27%, Colorado +17% and Tennessee’s +13%
- The states where active inventory is still FAR below pre-pandemic levels were: Connecticut -76%, Rhode Island -65%, New Jersey -64%, Vermont -61% and Illinois -60%.
Largest YoY Declines in Median Listing Prices (Jan 2026 vs. Jan 2025)
District of Columbia: -7.7% YoY
Hawaii: -6.8% YoY
Wyoming: -6.7% YoY
Iowa: -3.3% YoY
Massachusetts: -3.2% YoY
Illinois: -3.1% YoY
New Jersey: -2.8% YoY
Oregon: -2.7% YoY
Minnesota: -2.6% YoY
Arizona: -2.6% YoY
Florida: -2.3% YoY
Maine: -2.3% YoY
West Virginia: -2.1% YoY
Utah: -2.1% YoY
Dual-axis Charts Really Tell the Story
I love these charts. You can see the huge drawdown in inventory with the onset of COVID-19, the rebound in inventory as the Fed began raising rates to combat inflation, and the slowdown in price growth as that happened.
As an example, Wyoming had one of the most extreme pandemic price surges (+85% from pre-pandemic peak) but it is now experiencing the 3rd steepest price correction nationally at -6.7% YoY.

TP: I’ve got updated Price vs. Inventory charts for every state and D.C. ready to go. Just ask! (scott@highway.ai).
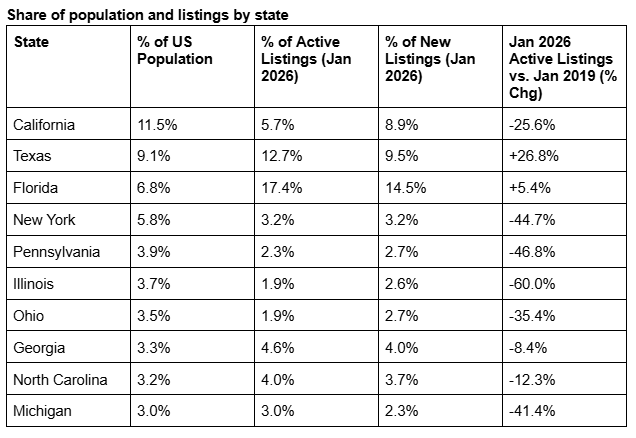
The Big Three States are Driving National Inventory Trends
Relative to their population, Florida and Texas continue to over-index for listings, while California significantly under-indexes. Florida has more than twice the listing share you’d expect given its population share, while California has half the listing share you expect given its population share.
Or looked at another way, Texas has 2.2X as many active listings (115K) as California does (52K), despite having only 78% of California’s population! And Florida has 3.0X as many active listings (158K) as California, despite having 59% of California’s population.
Bond and Mortgage Market
The market always reacts to the headline data, and the headline January BLS jobs figure was an absolute blowout. Not surprisingly, the likelihood of Fed rate cuts in March and April was significantly reduced. Still, all the positive bond-friendly data over the past 10 days, combined with analyst commentary pointing out the (many) holes in the BLS report, kept the damage contained. Average 30-year mortgage rates rose, but remained in the low 6% range.
Note: The Fed Funds Rate policy range is currently 3.50–3.75%. The probabilities below come from the CME Group website and are implied from the Fed Funds Rate futures market.
- March 18 FOMC Meeting: 94% probability that the Fed Funds Rate target range is kept at 3.50–3.75% (way up from 76% a week ago). In other words, no rate cut at the March FOMC meetings.
- April 29 FOMC Meeting: 79% probability that the Fed Funds Rate target range is kept at 3.50–3.75% (way up from 59% last week). In other words, no rate cut at EITHER the March or April meeting. 21% probability that rates will be 25% below current (was 36% last week), which implies a 25 bps rate at the April meeting.

They Said It
“The decrease in sales is disappointing. The below-normal temperatures and above-normal precipitation this January make it harder than usual to assess the underlying driver of the decrease and determine if this month’s numbers are an aberration.
Affordability conditions are improving, with NAR’s Housing Affordability Index showing that housing is the most affordable it’s been since March 2022. This is due to wage gains outpacing home price growth and mortgage rates being lower than a year ago. However, supply has not kept pace and remains quite low.” — Lawrence Yun, NAR’s Chief Economist, discussing the January 2026 Existing Home Sales figures
Related posts
.jpg)
Weekend Talking Points - 'Where the Homes Are'


The Power of Leverage in Homebuying

FAQ: What are the key costs to budget for when buying a home?
Ready to close more deals?
ListReports automatically delivers personalized marketing collateral to your inbox helping you engage with your customers and prospects.