
.jpg)
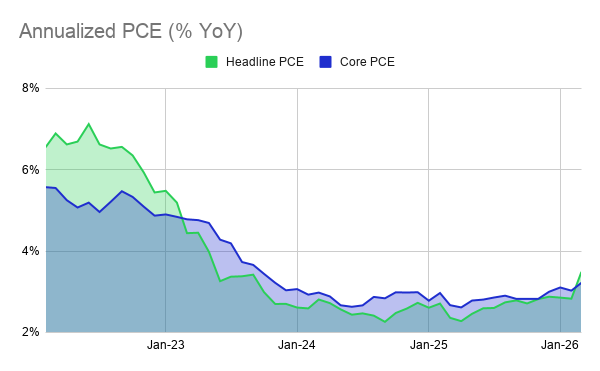
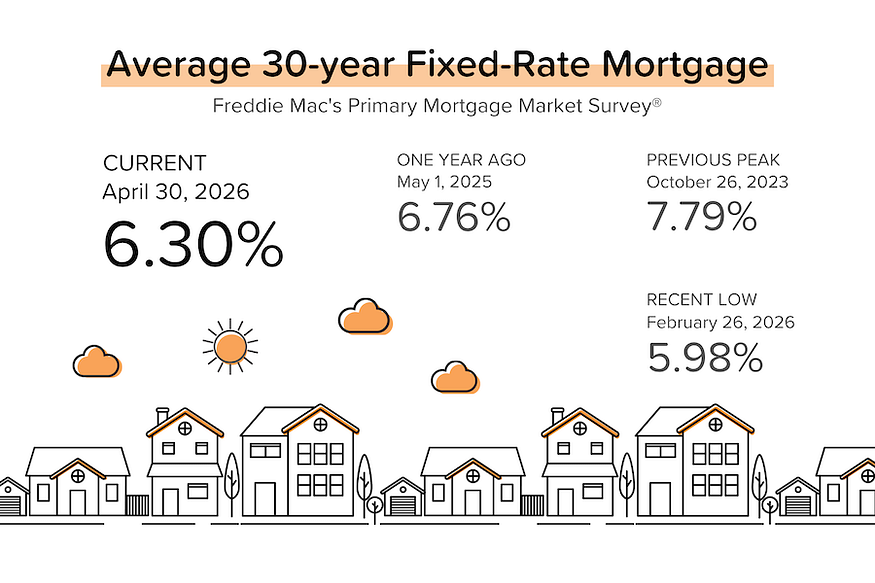
A day after the Fed voted to keep rates steady, the March PCE (inflation) figure jumped to +3.5% YoY, driven by higher oil prices. Mortgage rates moved up as well, but they’re still half a percent lower than they were a year ago, and flattish national home price growth is helping to improve affordability in many cities.
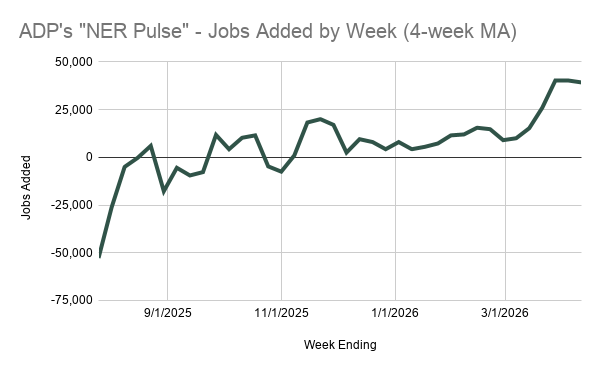
ADP: Job growth uptrend comes to a close. For the four weeks ending 4/11/2026, private employers added an average of 39,250 jobs per week. That ended a 5-week acceleration trend in job growth. But 39,250/week is still a solid number, implying that ADP’s April Employment Report will show around +160K jobs. [ADP]
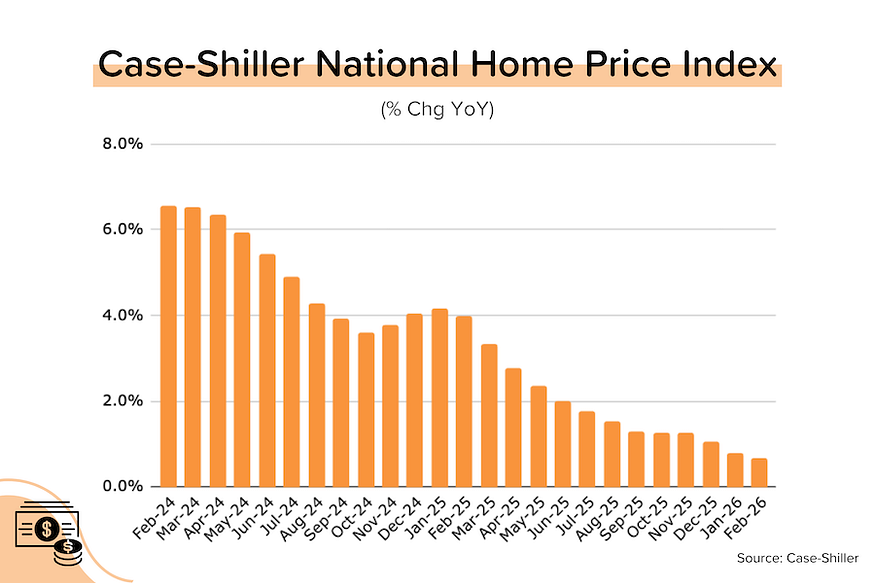
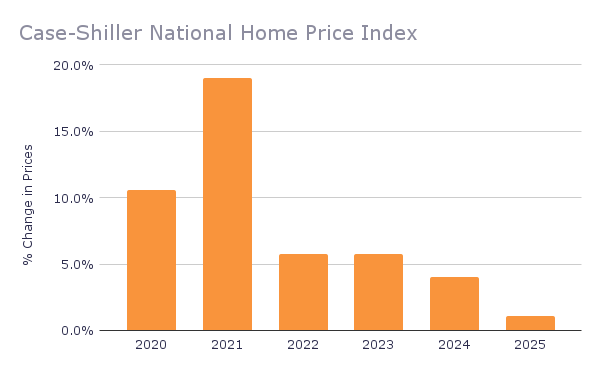
Case-Shiller: Home prices flattish in February. Despite some of the lowest mortgage rates we’ve seen in years, Case-Shiller’s SA national index rose just 0.1% MoM (+0.7% YoY) in February. It’s been years since we’ve seen annual growth this low. Half the big city indexes saw a MoM decline in February, a big jump from 5 in January and 1 in December. [More on this later]
TP: Remember, this data is from February — BEFORE the US/Iran conflict, and when average 30-year mortgage rates briefly hit 5.99%. With that in mind, the weak home price growth is surprising.
Fed keeps rates unchanged. At Jerome Powell’s last FOMC meeting as Chairman, Fed members voted to leave rates unchanged. With oil prices and inflation surging (March PCE jumped to +3.5% YoY from +2.8% YoY in February), this was no surprise. But 4 members dissented: 3 were more ‘hawkish’ (inclined to raise rates) and 1 was more ‘dovish’ (wanting to cut rates). Powell also said that he plans to stay on as a Fed Governor “for a time”. [Federal Reserve, BLS]
Housing starts jumped. In March, housing starts climbed 10.8% MoM to 1.502 million units (SAAR), the highest figure since December 2024. This increase in starts, while large, is consistent with the 11.0% MoM increase in new permits we saw in February (to 1.538 million units). Starts typically follow permits with a 1–2 month lag. [Census Bureau]
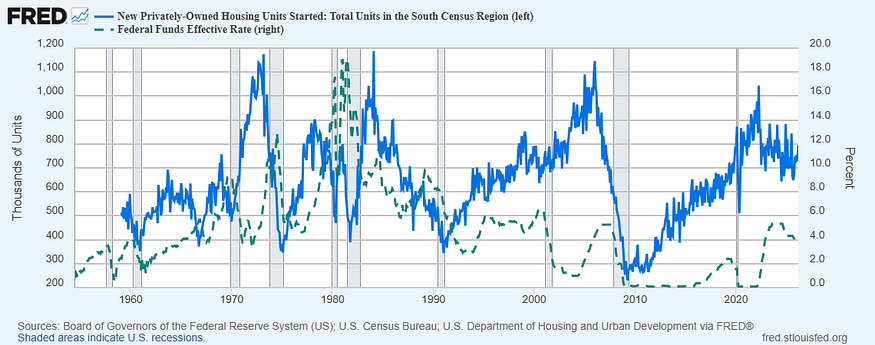
TP: There are two ways to look at the long-term chart of housing starts above. The first is to say that the home construction industry is in the dumps, with housing starts (solid blue line, LHS) that are well below 2021–2022 levels despite a housing shortage of 1–4 million units (depending on who you ask). The second way is to recognize that housing starts have not cratered, despite a historically aggressive cycle of Fed rate hikes (dotted green line, RHS) in 2022–2023! Why? Because underlying demand is strong (no recession).
Inflation (PCE) spiked on US/Iran conflict. We knew it was coming, but it’s still disheartening to see. Headline PCE rose 0.7% MoM in March, boosting annual inflation from +2.8% YoY in February to +3.5% YoY. The core PCE figure was a bit better: +0.3% MoM, +3.0% YoY → +3.2% YoY. As a reminder, core PCE hit a low of +2.6% in April 2025. Since then, inflation has been accelerating.
1Q 2026 GDP came in a bit light. Wall Street economists were looking for ~2.3% annualized growth. Instead, we got 2.0%. And a big chunk of the growth we got came from AI-related investments (the tens of billions you keep hearing about Google and Meta spending) and healthcare.
On the Case (Shiller) Again in February
Annual price growth for Case-Shiller’s seasonally-adjusted national index was basically flat at +0.7% YoY in February 2026. Year-over-year price growth has been decelerating for two years (was +6.6% YoY in February 2024).
As we do each month, we looked at the 20 Big City indexes in detail. Here’s what we found:
- 10 of the 20 big city indexes saw declines in their SA home price indexes in February 2026 (up from 5 in January and 1 in December. [See bar chart below.]
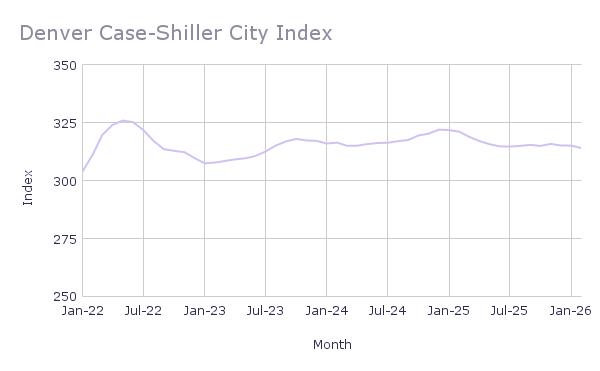
- The largest price drops came from Seattle (-1.18% MoM), followed by Dallas (-0.48%), Phoenix (-0.35%), Minneapolis (-0.35%), and Denver (-0.34%).
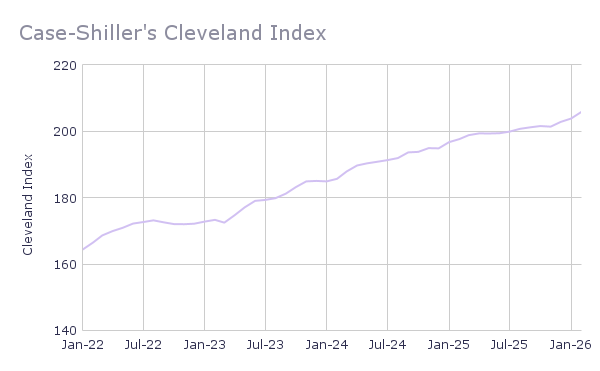
- The largest price increases came from Cleveland (+0.99% MoM), Chicago (+0.85% MoM), Miami (+0.76% MoM), and New York (+0.61% MoM). The strength in Midwest and Northeast metros continues to stand out.
- Eleven of the 20 big cities are seeing (generally modest) YoY price declines in their SA home price indexes. The steepest: Denver (-2.20% YoY), Tampa (-2.05% YoY), Seattle (-2.02% YoY), Phoenix (-1.78% YoY), and Dallas (-1.74% YoY).
- Only 4 cities made new all-time highs in February 2026: Charlotte, Chicago, Cleveland, and New York City.
- Seven cities’ price indexes are still below their mid-2022 peak levels: San Francisco (-5.7%), Denver (-3.7%), Phoenix (-3.3%), Seattle (-2.7%), Dallas (-2.7%), Portland (-1.8%), and Tampa (-1.6%).
Reminder: The Case-Shiller index is the gold standard for measuring home price growth because it uses the repeat sales method (looking at ‘pairs’ of transactions for the same home) to more accurately gauge true appreciation. However, this accuracy comes at a cost: a nearly two-month time lag.
Bond and Mortgage Market
Two things pushed US treasury yields (and mortgage rates) higher this week. First, no peace talks, and so no near-term end to the US/Iran conflict (or higher oil prices). Second, the hawkish Fed dissent and Powell’s decision to stay on as a Fed Governor could complicate incoming Fed Chair Warsh’s ability to engineer a more dovish consensus.
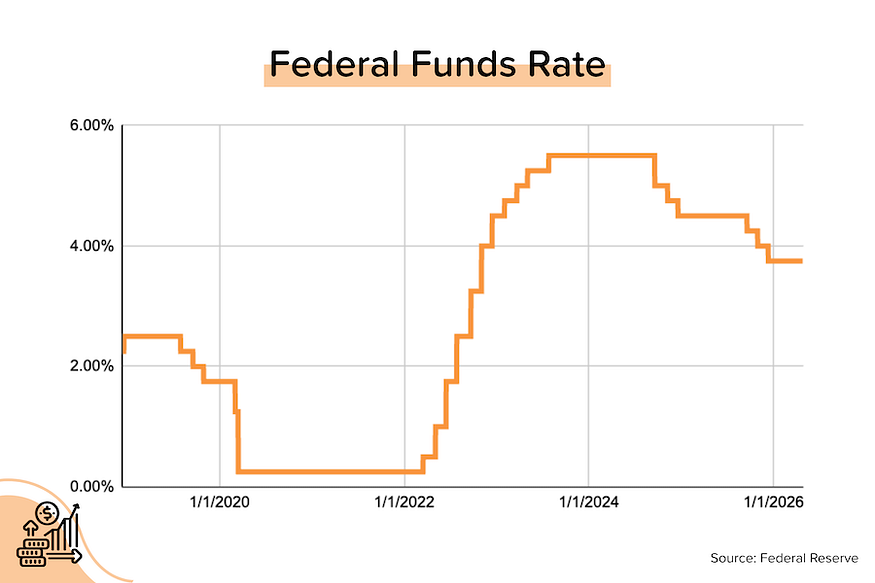
Note: The Fed Funds Rate policy range is currently 3.50–3.75%. The probabilities below come from the CME Group website and are implied from the Fed Funds Rate futures market.
- June 17 FOMC Meeting: This will be Kevin Warsh’s first meeting as the new Fed Chairman. 95% probability that the Fed Funds Rate will be kept at 3.50–3.75% (was 98% last week). That leaves only a 5% probability that rates will be 25 basis points lower than current.
- July 29 FOMC Meeting: 89% probability that the Fed Funds Rate will be kept at 3.50–3.75%. An 11% probability that rates will be 25 basis points lower than current (implying a rate cut at either the June 17 or July 29 meetings, but not at both).
- No rate cut in 2026? If I look way out to the last FOMC meeting of the year (Dec 9), the market is pricing in an 80% probability (was 65% last week) that the Fed Funds Rate will be exactly where it is today. In other words, the market continues to price in NO rate cuts for the entirety of 2026.
They Said It
“You know, I think I am confident…that the Fed will continue to make its decision based on analysis, rigorous analysis, and not on political considerations. But we’ve had to fight for it. And, you know, I’d like to think that — you know, I like to think we can get out of that era, and go back to respecting, you know, what the law says and what custom has been, which is to, you know, let the Fed do our thing. You know, we’re not — it’s an institution full of human beings who work super hard to get things right for the benefit of the public. We’re all human. Don’t expect perfection. But do expect us to make, you know, decisions without political considerations and the very best analysis we can bring.” — Jerome Powell, outgoing Federal Reserve Chairman
Related posts
.png)
Inflation Eases, Housing Faces Headwinds


FAQ: Can I use gift funds for my down payment?
.jpg)
July 2026 MBS Highway Housing Index
Ready to close more deals?
ListReports automatically delivers personalized marketing collateral to your inbox helping you engage with your customers and prospects.