
.jpg)
This was meant to be “jobs week” (JOLTs, ADP, BLS), but on account of the government shutdown, we only got ADP. On a nationwide basis, home prices are basically flat YoY, but that masks significant variation at the state and city level (half are down, half are up).
ADP: Jobs growth swung positive, but remained weak. Private employers added a net 42,000 jobs in October, a notable improvement after two consecutive months of net job losses. Wage growth for “job stayers” was steady at +4.5% YoY, while wage growth for “job changers” rose slightly to +6.7% YoY (from +6.6% YoY).
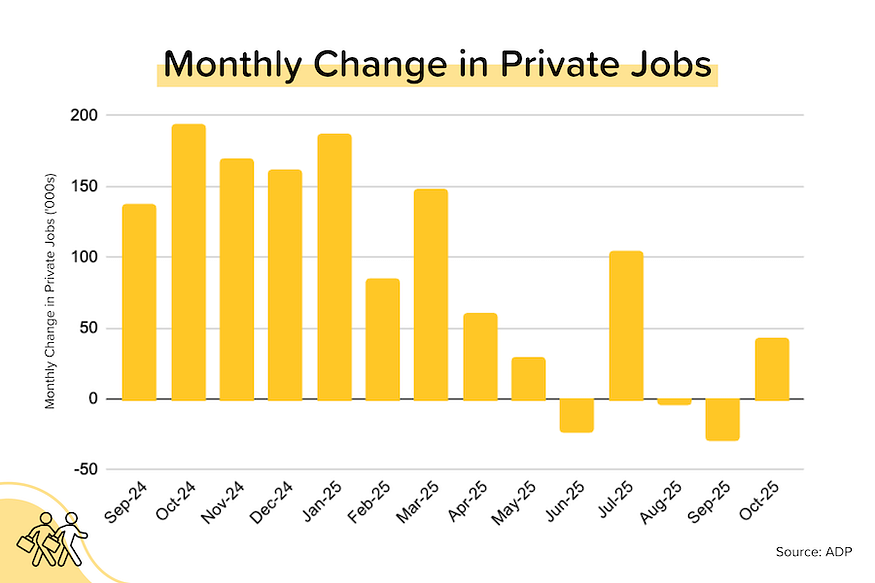
TP: It’s important to recognize that +42,000 jobs is NOT a strong number. Pre-pandemic, it was not unusual to see numbers between +100,000–200,000 per month. At the same time, annual wage growth — and the premium to switching jobs vs. staying — remains low. Broadly speaking, this report is consistent with a lackluster job market (“no hire, no fire”) and modest inflation.
Inventory recovery slows. According to Realtor.com, Nationwide active inventory (excludes homes already under contract) was flat month-over-month in October at 1.1 million units. But that means that YoY growth slowed to +15% YoY (from +17% in September). Nationwide median listing prices were flat YoY, but half the individual states saw YoY price declines and 18 states have active inventory that is above pre-pandemic levels. [More on this later.]
Cotality: Price growth decelerates, but outlook still bullish. The national median home price rose just +1.2% YoY in September (down from +1.3% YoY in August). But that’s a balance between still-strong price growth in the Midwest/Northeast and weak or negative price growth in the South.
TP: Interestingly, Cotality still forecasts +4.1% price growth over the next 12 months. Why? We have to assume that they expect mortgage rates will continue to fall, boosting demand and reigniting price growth.
Latest Housing Data from Realtor.com
In October 2025, total active inventory (which excludes homes under contract) rose +15% YoY to 1.1 million units. That looks strong, but it’s actually a significant deceleration from +25% YoY in July 2025 and +31% YoY in April 2025. At the national level, active inventory is currently 9.5% below pre-pandemic levels. Nationwide median listing prices, meanwhile, were basically flat (+0.4% YoY) at $424K. But that masks significant variation at the state and metro level.
State-level Observations
- Half (24) the states are seeing (generally modest) year-over-year declines in their median listing prices. Prices are down 6% YoY in Hawaii and 4% YoY in Arizona.
- 18 of the states have active inventory levels (Oct 2025) that are above pre-pandemic (Oct 2019) levels. Arizona’s inventory is 37% above pre-pandemic levels; Tennessee’s is 35%.
Metro-level Observations
- Keep in mind: the Top 100 cities (by number of households) have 66% of the nation’s active inventory. The Top 200 cities have 80% of the nation’s active inventory.
- The total active inventory for the Top 100 cities in October 2025 was 8% below pre-pandemic levels (October 2019). The total active inventory for the next 100 cities (101–200) was 5% below pre-pandemic levels.
- In October 2025, 54% of the Top 100 metros had median listing prices that were down year-over-year (was 60% last month), with a median decline of around 1.6%. Looking at the next 100 cities, 48% had a YoY decline with a median drop of 3.0%.
- The biggest YoY declines in listing prices among the major metros were seen in Reading PA (-7.9%), Charleston SC (-7.9%), Honolulu HI (-7.1%), Cape Coral-Ft Myers FL (-6.9%), Naples FL (-6.6%), Savannah GA (-6.4%), Austin TX (-5.7%), San Diego CA (-5.1%), LA/Long Beach CA (-4.4%), and Miami-Ft Lauderdale FL (-4.8%).
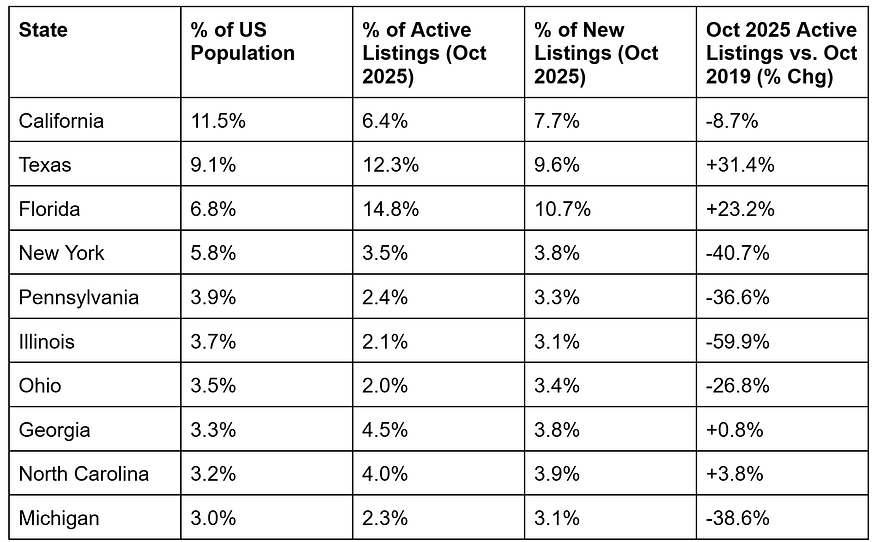
Inventory Levels for the 10 Largest States by Population
Relative to their population, Florida and Texas both over-index for listings, while California significantly under-indexes. In other words, California should have a lot more listings than it has, given that it is still the largest state by population. Texas has nearly twice as many active listings as California does, despite having only 78% of California’s population!
There are currently 18 states with inventory levels (October 2025) that are ABOVE their pre-pandemic levels (October 2019). There were 16 last month. Most of the states with inventory levels that are well above pre-pandemic levels are in the South or Mountain West.
18 States where Inventory Levels (Oct 2025) are ABOVE Pre-Pandemic Levels (Sept 2019)
District of Columbia: +75.7%
Arizona: +36.8%
Tennessee: +35.4%
Texas: +31.4%
Colorado: +26.5%
Utah: +24.1%
Florida: +23.2%
Washington: +22.8%
Idaho: +17.9%
Oklahoma: +12.1%
Nevada: +5.5%
North Carolina: +3.8%
Alabama: +3.2%
Arkansas: +2.1%
Nebraska: +2.1%
Hawaii: +1.7%
Oregon: +1.1%
Georgia: +0.8%
And as you’d expect, the states seeing the largest price declines are also the states with the highest inventory levels relative to pre-pandemic: D.C., Arizona, Texas, Colorado, and Florida.
24 States where Median Listing Prices are Falling YoY (Oct 2025 vs. Oct 2024)
Hawaii: -5.6% YoY
District of Columbia: -4.1% YoY
Arizona: -4.0% YoY
New Jersey: -3.9% YoY
Wyoming: -3.2% YoY
Texas: -3.0% YoY
Colorado: -2.3% YoY
California: -2.3% YoY
Florida: -2.2% YoY
Iowa: -2.1% YoY
Utah: -2.0% YoY
Not shown: GA, IL, KS, LA, MA, MN, MT, NE, NV, NY, OR, SD, WA (all declining, but <2% YoY).
Bond and Mortgage Market
Last week, the Fed cut rates by 25 basis points, but Jerome Powell’s commentary that another rate cut in December was “not a foregone conclusion” rattled the bond markets. The yield on the 10-year US Treasury bond moved back above 4%, going as high as 4.12%.
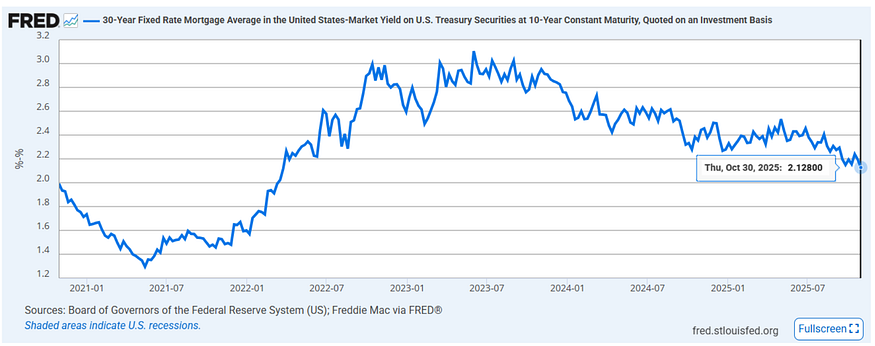
But as you know, mortgage rates have their own market dynamics. Over the last few years, the “mortgage spread” between average mortgage rates and the yield on the 10-year US Treasury bond has been narrowing. In mid-2022 it got as high as 3.0%. Today it’s at 2.1%. Historically, it’s been 1.6–1.8%. When the “mortgage spread” gets smaller, mortgage rates can move down even if Treasury yields are flat or slightly up. And that’s what’s been happening lately.
Note: After the rate cut on Oct 29, the Fed Funds Rate policy range is now 3.75–4.00%. The probabilities below come from the CME Group website and are implied from the Fed Funds Rate futures market.
- December 10 FOMC Meeting: 69% probability that rates will be 25 bps below current (was 87% last week and 91% the week before that). In other words, another 25 bps rate cut on December 10. But a solid (and growing) 31% probability that the Fed will keep rates on hold.
- January 28 FOMC Meeting: 57% probability that rates will be 25 bps below current (was 49% last week). That implies a 25 bps rate cut at one, but not both, of the December and January meetings. 23% probability that rates will be 50 bps below current (was 44% last week).
They Said It
“Private employers added jobs in October for the first time since July, but hiring was modest relative to what we reported earlier this year. Meanwhile, pay growth has been largely flat for more than a year, indicating that shifts in supply and demand are balanced.” — Nela Richardson, ADP’s Chief Economist
“Although recent declines in mortgage rates have provided support for housing activity, broader improvements in demand will depend on the strength of the labor market and corresponding consumer confidence.” — Dr. Selma Hepp, Cotality’s Chief Economist
“I think that we are in good shape, but I think that there are sectors of the economy that are in recession…and the Fed has caused a lot of distributional problems with their policies…so if the Fed brings down mortgage rates, then they can end this housing recession.” — Scott Bessent, US Treasury Secretary
Related posts
.jpg)
Weekend Talking Points - 'Weak Jobs Week'


Pivotal Week for the Fed
.png)
Fed Holds Rates Steady, Trump Names Chair Pick
Ready to close more deals?
ListReports automatically delivers personalized marketing collateral to your inbox helping you engage with your customers and prospects.