
.jpg)
We find ourselves in a data vacuum. No BLS jobs report last week. Maybe no CPI report next week. But mortgage rates are holding steady near 6.3%, and the market is still expecting two Fed rate cuts before year end.
No BLS jobs data last Friday. Thanks to the government shutdown, the BLS employment report for September wasn’t released. Was the analysis at least finished? Has Jerome Powell seen the data? We don’t know. Separately, the Carlyle Group (a giant investor) said that it estimated that the US economy added just 17,000 jobs in September, well below Wall Street expectations of +54,000. [ADP, Carlyle Group]
TP: As a reminder, the BLS reported +22,000 jobs in August, while ADP reported 32,000 net job LOSSES in September.
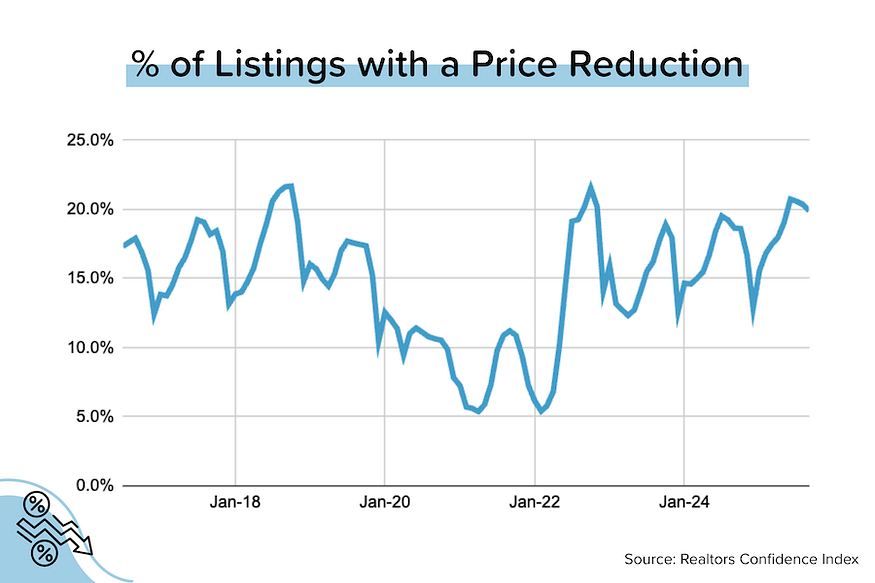
The shift to a buyer’s market. It’s happening, to different degrees in different places, but the shift is noticeable and indisputable. You see it rising inventory levels, longer Days on Market, and increased prevalence of listing price reductions. That said, this is no crash, with price declines in most metros still very modest relative to pandemic-era price gains. [NAR]

Inventory rebound is slowing & prices are trending lower. In September 2025, total active inventory (which excludes homes under contract) rose +17% to 1.1 million units. That’s a significant deceleration from +25% YoY in July 2025 and +31% YoY in April 2025. At the national level, active inventory is currently 10% below pre-pandemic levels. Median listing prices, meanwhile, are down YoY for about 60% of the Top 100 (and about 53% of the next 100) metros. But the declines in most metropolitan areas are fairly modest. [Realtor.com]
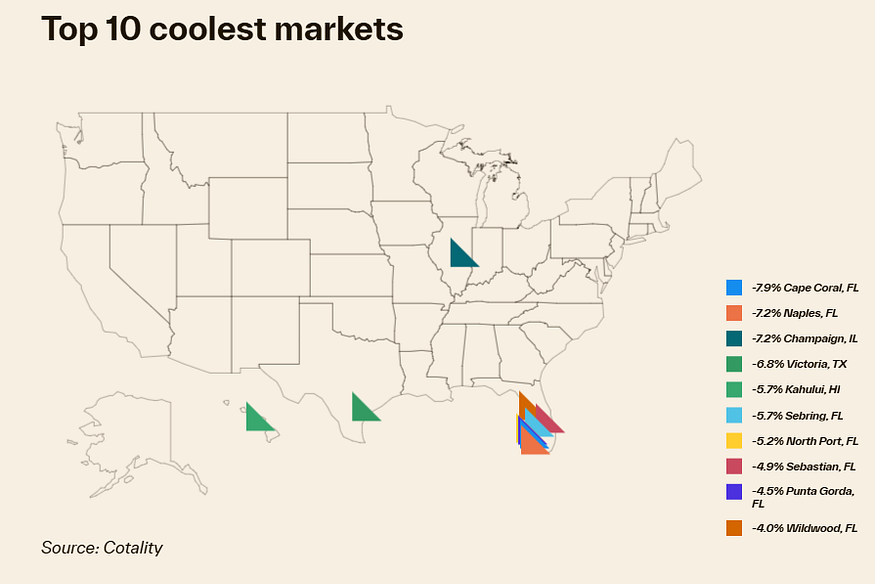
Home price growth continues to slow. In August, national home prices rose just 1.3% year-over-year and fell 0.3% month-over-month (the second-straight monthly decline). Seven of the Top 10 metros reporting negative MoM price growth were in FL. [Cotality]
Cash is (still) king. In 1H 2025, all-cash buyers were 32.8% of sales. That’s down from 33.4% in 1H 2024, but is still a good deal higher than pre-pandemic. 40–50% of sales were all-cash in Mississippi & New Mexico (relatively affordable markets), Maine & Hawaii (high-priced markets where the wealthy play) and Montana & Idaho (big markets for 2nd home buying).
As mortgage rates come down, not only are we going to get more buyers (improved affordability), and sellers (less of a ‘lock-in’ effect), but we should ALSO get a higher % of first-time buyers and transactions involving financing.

TP: The main all-cash buyers are investors (who dominate all-cash sales), second-home buyers, and wealthy/older households who may have large home equity. This mix of buyer types creates some interesting dynamics: all-cash buying is a barbell, with concentration on the low end of home prices (where more people can come up with $180K) AND the high end (wealthy people buying million-dollar lodges in Montana).
Realtor.com’s Market Data for September 2025
In September 2025, total active inventory (which excludes homes under contract) rose +17% to 1.1 million units. That’s a significant deceleration from +25% YoY in July 2025 and +31% YoY in April 2025. At the national level, active inventory is currently 9.5% below pre-pandemic levels.
Detailed Observations:
- Keep in mind: the Top 100 cities (by number of households) have 66% of the nation’s active inventory. The Top 200 cities have 80% of the nation’s active inventory.
- The total active inventory for the Top 100 cities in Sept 2025 was 9% below pre-pandemic levels (Sept 2019). The total active inventory for the next 100 cities was 6% below pre-pandemic levels.
- In September 2025, 60% of the Top 100 metros had median listing prices that were down year-over-year, with a median decline of around 1.6%. Looking at the next 100 cities (101–200), 53% had a YoY decline with a median drop of 3.0%.
- The biggest YoY declines in listing prices among major metros were seen in Honolulu HI (-8.8%), Durham NC (-7.5%), Cape Coral-Ft Myers FL (-7.0%), Bridgeport-Stamford-Danbury CT (-5.8%), Charleston SC (-5.2%), San Diego CA (-4.9%), Austin TX (-4.8%), LA/Long Beach CA (-4.8%), and Miami-Ft Lauderdale FL (-4.8%).
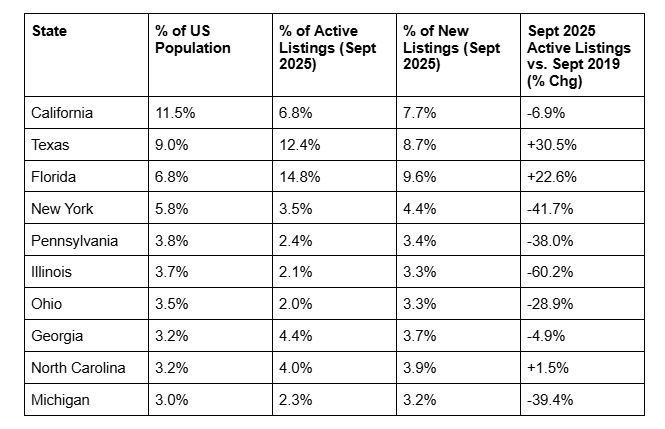
Inventory Levels for the 10 Largest States by Population
Relative to their population, Florida and Texas both over-index for listings, while California significantly under-indexes. In other words, California should have a lot more listings than it has, given that it is still the largest state by population. Texas has nearly twice as many active listings as California does!
There are currently 16 states with inventory levels (September 2025) that are ABOVE their pre-pandemic levels (September 2019). You’ll notice that the majority of these states are in the South and Mountain West. Most of these states benefited heavily from pandemic-era migration trends AND saw huge home price movements between 2020–2022.
States where Inventory (Sept 2025) is ABOVE Pre-Pandemic Levels
District of Columbia: +79.1%
Tennessee: +34.8%
Texas: +30.5%
Colorado: +28.6%
Arizona: +27.8%
Washington: +25.4%
Florida: +22.6%
Utah: +22.0%
Idaho: +21.3%
Oklahoma: +8.8%
Nevada: +4.4%
Hawaii: +2.7%
Nebraska: +1.8%
Oregon: +1.6%
Alabama: +1.5%
North Carolina: +1.5%
So are home price trends reflecting the supply situation in these states? In general, yes. There are currently 26 states where median listing prices are DOWN year-over-year, and 10 of these 26 (38%) were also in the list above (had inventory above pre-pandemic levels). That said, the declines are pretty modest considering how much home prices rose during COVID.
States where Median Listing Prices are Falling (Sept 2025 vs. Sept 2024)
Hawaii: -6.3% YoY
New Jersey: -4.0% YoY
Arizona: -4.0% YoY
Iowa: -3.7% YoY
Massachusetts: -3.3% YoY
District of Columbia: -3.0% YoY
Florida: -2.8% YoY
Texas: -2.7% YoY
Illinois: -2.6% YoY
California: -2.5% YoY
Not shown: CO, MT, SD, UT, WY, KS, OR, MN, DE, NV, NE, MS, WA, NY, ND, GA (all declining, but <2% YoY).
Would you like a price vs. inventory chart for your state, county or metro? Just email me! (scott@listreports.com)
Bond and Mortgage Market
Average 30-year mortgage rates got as low as 6.13% in mid-September before quickly rebounding to ~6.30%. And they’ve hovered around those levels for the last three weeks. In the absence of official government data, the market has taken its cues from: 1) private data sources like ADP (generally evidencing a weaker job market), and 2) moves in international bond yields (generally higher).
We are supposed to get the September CPI (inflation) data next Wednesday, but that may not happen if the government shutdown continues.
Note: The Fed Funds Rate policy range is now 4.00–4.25%. These probabilities come from CME Group website and are implied from the Fed Funds Rate futures market.
- October 29 FOMC Meeting: 95% probability that rates will be 25 bps below current (down slightly from 99% last week). In other words, a second 25 bps rate cut on October 29.
- December 10 FOMC Meeting: 82% probability that rates will be 50 bps below current (down slightly from 87% last week). In other words, a third 25 bps rate cut on December 10.

They Said It
“Enhanced affordability has provided much-needed relief to the housing market, which has experienced limited momentum over the past two years. Consequently, recent increases in mortgage application activity indicate that homebuyers are gradually re-entering the market. Rising inventories are providing buyers with more choices while price cuts are now more common in certain local markets. This has slowly shifted negotiating power towards buyers — if they can afford to act. But, with some sellers pulling back and further expected decline in mortgage rates, price pressures could resurge.” — Dr. Selma Hepp, Cotality’s Chief Economist
Related posts
.jpg)
Weekend Talking Points - 'Early Spring'


January 2026 MBS Highway Housing Index
.png)
Soft Jobs Data, Slower Home Construction
Ready to close more deals?
ListReports automatically delivers personalized marketing collateral to your inbox helping you engage with your customers and prospects.