
.jpg)
In three of the last four months, ADP’s private employment figure has gone backwards. In other words, the economy is losing jobs on a net basis. That doesn’t sound like a ‘solid’ job market to me.
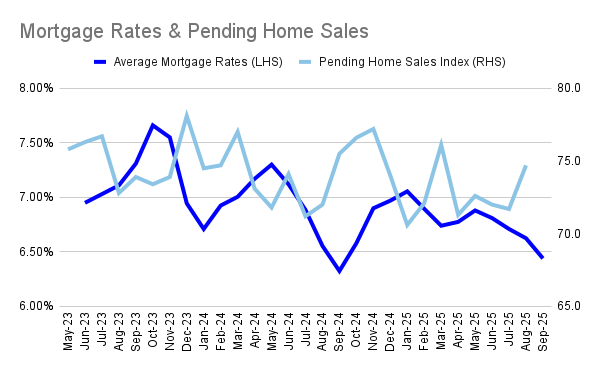
Pending sales finally go positive. In August, the NAR’s Pending Home Sales Index (PHSI = tracks the number of homes going under contract) rose 4.0% month-over-month (and +3.8% year-over-year) to 74.7. That’s the 2nd-highest index level we’ve seen this year. It’s also the strongest YoY growth experienced since November 2024. Growth was particularly strong in the more-affordable Midwest region (+8.7% MoM, 6.7% YoY). [NAR]
TP: What does this tell you? With mortgage rates down nearly 40 basis points (0.4%) over the last two months, and inventory levels up significantly YoY in most markets, buyers are coming off the sidelines. By the way, the PHSI of 74.7 suggests that existing home sales could exceed 4.1 million (SAAR) in September.
Lock-in effect is still big, but fading. According to Redfin data, 80.3% of mortgaged US homeowners have a rate below 6%. That means that the majority of mortgaged homeowners would need to give up an attractive rate if they were to sell their existing home and buy a new one. In other words, the lock-in effect is still big. [Redfin]
But let’s flip that datapoint around: it also means that 19.7% of mortgaged homeowners (100.0% minus 80.3%) have a rate that is 6% or higher, which is actually the highest share since 4Q 2014! So the lock-in effect is fading.
TP: These percentages are changing because: 1) around 4 million existing homes were sold in each of 2023–2025, at much higher average mortgage rates than during the pandemic, and 2) because sometimes when ‘life happens’ you have to make a move, even if you’re giving up a very low rate.
There are about 87 million mortgages in the US. If 20% have rates that are 6% or above, that means that there are 17 million mortgages that are “in play” (a homeowner might already be able to profitably refinance, or the homeowner wouldn’t necessarily see a huge increase in their mortgage rate if they sold their existing home and bought a new one).
Rental vacancy rate hit a new record. According to Apartment List, the nationwide vacancy rate hit 7.1% in September, a new high for the series. While the new home/apartment construction boom peaked in 2024 (with more than 600K completions), 243K units were completed in 1H 2025 and 686K units are still under construction. Rental rates, meanwhile, are down -0.8% YoY and are down about 3% since rents peaked in mid-2022. [Apartment List]
Case-Shiller — price declines continue. Case-Shiller’s (seasonally adjusted) national home price index grew just +1.7% YoY in July 2025, down from +1.9% YoY in June 2025. But most of those gains happened at the start of the year. The index has actually DECLINED month-over-month for the past 5 months. [S&P Global DJI]
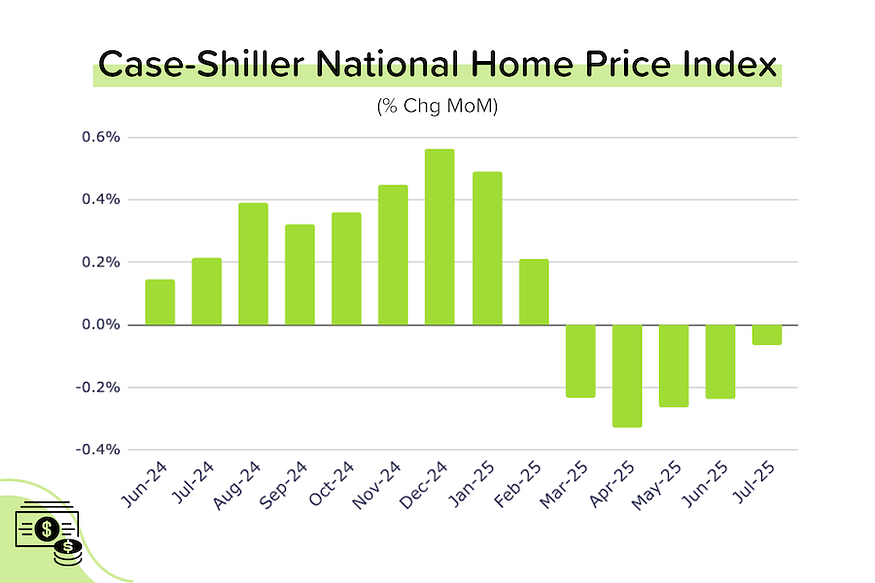
TP: Year-to-date, the national index is down 0.4%. Between end-2019 and today, the index is up 52.6%. It’s important to keep perspective. [Much more on this later.]
FHFA — seeing something similar. The FHFA’s (seasonally adjusted) national home index declined 0.1% MoM in July (the 4th-straight MoM drop), with YoY price growth slowing to +2.3% (from +2.6% YoY in June). The strongest growth was seen in the Middle Atlantic region (+5.1% YoY), and the lowest growth was in the Pacific Region (+0.2% YoY). [FHFA]
TP: As a reminder, the FHFA index is constructed using a similar ‘repeat sales’ method to Case-Shiller. That makes it an accurate gauge of true home price appreciation. But…the dataset is slightly different. The FHFA index only considers home purchased with a conforming mortgage, so all-cash deals and homes purchased with jumbo loans are not considered.
JOLTs — Nothing shocking. Job openings were pretty much flat in August at 7.2 million. Both the hiring rate (3.2%) and the quits rate (1.9%) were at/near 10 year lows. This ‘no hire/no fire’ environment speaks to the lack of confidence of both employers (of strong growth ahead) and employees (of being able to find a higher-paying job). [BLS]
ADP — Jobs going backwards. Giant payroll processor ADP reported that private employers LOST a net 32,000 jobs in September. That was way below expectations for 45,000 in job GAINS. In addition, the jobs number for August was revised down from +54,000 to -3,000. That means that the number of jobs has declined in three out of the last four months. Is this the ‘solid’ job market Fed Chairman Jerome Powell keeps talking about? [ADP]
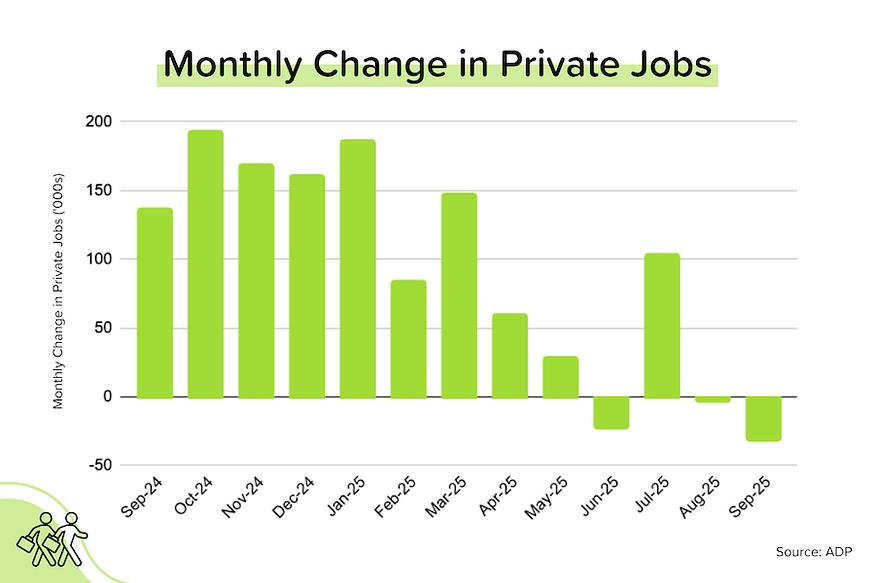
TP: Due to the government shutdown, the release of the BLS jobs report for September has been delayed. As such, the ADP report assumed prominence…and sent bond prices higher (and bonds yields lower).
On the Case (Shiller) for July 2025
Annual price growth for Case-Shiller’s seasonally-adjusted national index decelerated further to just +1.7% YoY in July 2025. (We started the year at +4.1% YoY!) July 2025 also marked the 5th-straight month of MoM declines in the index. That said, the magnitude of the decline was much smaller in July, and fewer individual cities posted MoM drops.
Annualize the last 6 months of data and you get -1.8%. Annualize the last 3 months and you get -2.3%. Basically prices are running flattish to down except for some major cities in the Northeast and Midwest.
As we do each month, we looked at the 20 big city indexes in detail. Here’s what we found:
- Only 10 of the 20 big city indexes saw their SA indexes decline MoM in July (much better than the 17 down last month). The largest drops were seen in Phoenix (-0.9% MoM), Las Vegas (-0.9% MoM), Tampa (-0.6% MoM) and Miami (-0.6% MoM).
- The biggest MoM increases came from Chicago (+0.5% MoM), Minneapolis (+0.5% MoM) and Portland (+0.5% MoM). The highest annual growth came from New York City (+6.4% YoY) and Chicago (+6.2% YoY).
- 7 of the 20 big cities are now seeing YoY price declines in their SA indexes (unchanged from last month): Tampa (-2.8% YoY), San Francisco (-1.9% YoY), Miami (-1.3% YoY), Dallas (-1.3% YoY), Phoenix (-0.9% YoY), San Diego (-0.7% YoY) and Denver (-0.6% YoY).
- Only five cities made new all-time highs in July: NYC and Chicago were joined by Minneapolis, Cleveland, and Detroit.
Reminder: The Case-Shiller index is the gold standard for measuring home price growth because it uses the repeat sales method (looking at ‘pairs’ of transactions for the same home) to more accurately gauge true appreciation. However, this accuracy comes at a cost: a nearly two-month time lag.
So is this a crash?
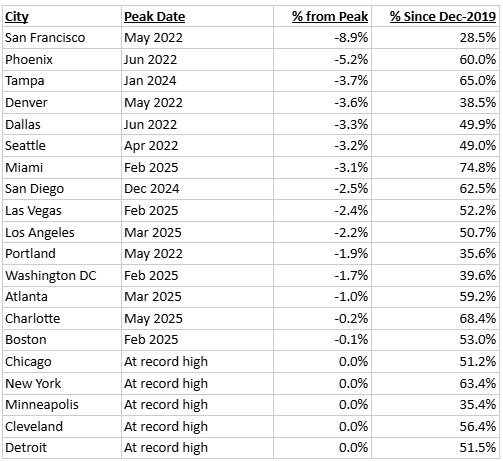
Hardly. I’d still call it a healthy correction. Healthy, because it is establishing new equilibrium pricing that should lead to higher transaction volumes. Correction, because the % decline from the peak is very modest relative to the total price gains seen since December 2019 — for every large city, except for (perhaps) San Francisco.
Here’s how you read the table below: Phoenix’s Case-Shiller home price index peaked in mid-2022 (similar to many cities). While the latest reading for the index (July 2025) is 5.2% below that mid-2022 level, Phoenix home prices have still risen 60% since end-2019.
Other things worth nothing from the table above:
- Only five cities (Chicago, New York, Minneapolis, Cleveland and Detroit) are still hitting new highs. Notice that they’re all from the Northeast or Midwest, where inventory levels are (in general) still well below pre-pandemic levels. In addition, these cities lagged Sunbelt and Mountain cities as prices spiked during the pandemic.
- Six cities (San Francisco, Phoenix, Denver, Dallas, Seattle and Portland) never fully recovered from their 2H 2022 price downturns.
- Despite prices falling 3.1% from the peak, Miami still boasts the highest overall price growth since end-2019 (+74.8%). That’s equivalent to a compound annual growth rate (CAGR) of 10.3%.
- San Francisco has seen the lowest overall price growth since end-2019: +28.5%, which works out to a CAGR of 4.5%. That’s actually still pretty good! It’s also roughly in line with the very long-term CAGR for the Case-Shiller national home price index.
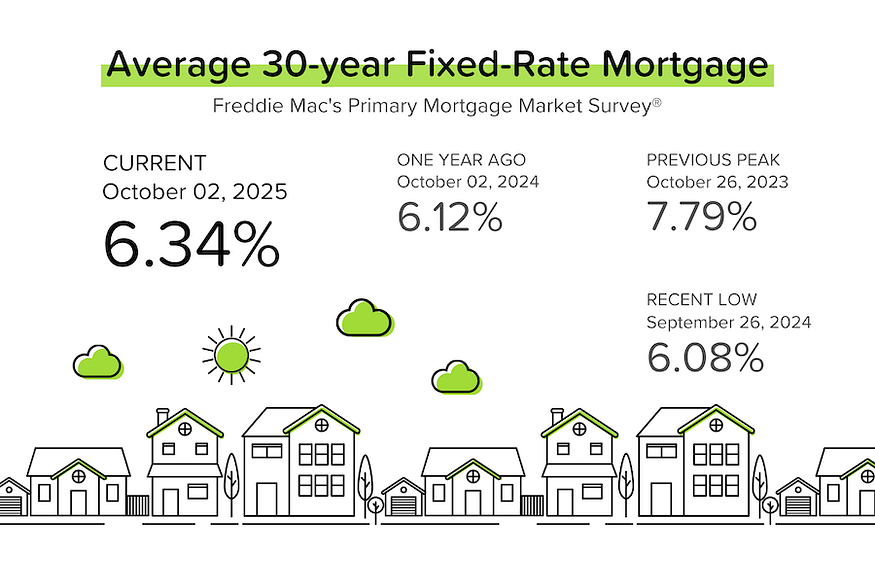
Bond and Mortgage Market
Given all the issues with the BLS jobs report (consistently large, negative revisions), the ADP report was already becoming more important. But with the September BLS jobs report release delayed by the government shutdown, the weaker than expected ADP report became the primary market mover during ‘jobs week’. Effectively, the ADP report convinced the market (once again) that the Fed will cut rates at each of the last two meetings of the year.
Note: The Fed Funds Rate policy range is now 4.00–4.25%. These probabilities come from CME Group website and are implied from the Fed Funds Rate futures market.
- October 29 FOMC Meeting: 99% probability that rates will be 25 bps below current (up from 86% last week). In other words, a second 25 bps rate cut on October 29.
- December 10 FOMC Meeting: 87% probability that rates will be 50 bps below current (way up from 65% last week). In other words, a third 25 bps rate cut on December 10.
They Said It
“Despite the strong economic growth we saw in the second quarter, this month’s release further validates what we’ve been seeing in the labor market, that U.S. employers have been cautious with hiring.” — Nela Richardson, ADP’s Chief Economist
Related posts
.png)
Job Market Slows, Inflation Below Forecasts

.jpg)
Weekend Talking Points - 'Good Data'
.jpg)
The Fed’s Dovish Shift in 2026
Ready to close more deals?
ListReports automatically delivers personalized marketing collateral to your inbox helping you engage with your customers and prospects.