
.jpg)
The Fed cuts rates and mortgage rates go up? That’s counterintuitive, isn’t it? Well, yes, it would be, if it were true. But it isn’t. Markets anticipate change, and the bond markets had already priced in multiple Fed rate cuts well in advance of the actual Fed meeting.
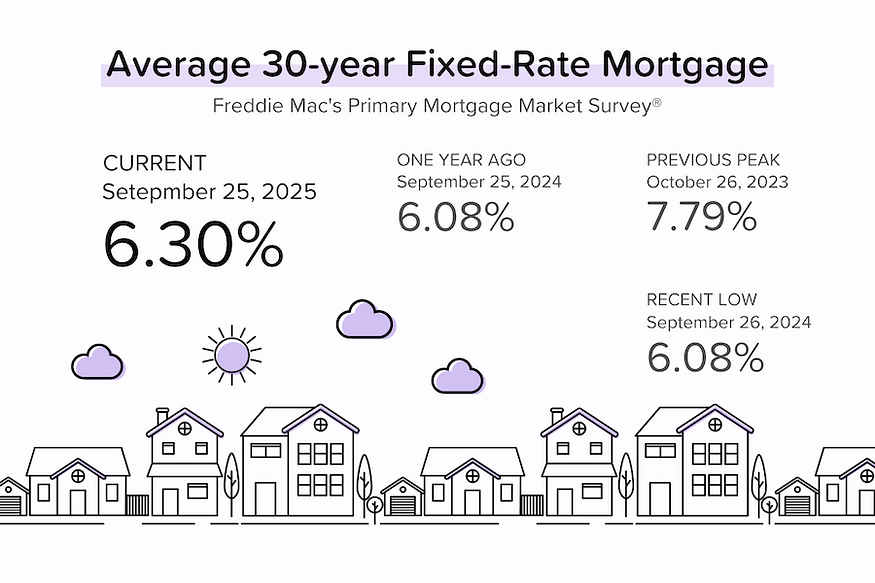
The Fed decision and mortgage rates. The Fed cut short-term interest rates by 25 basis points (0.25% or one-quarter of a percentage point) on September 17. Since then, average 30-year mortgage rates have RISEN from 6.13% to 6.37%. Naturally, the media gleefully ran with headlines like “Fed cuts rates but mortgage rates still increase.”
While those headlines are technically true, they fail to understand how stock and bond markets actually work. Markets anticipate change. Average 30-yr mortgage rates had already fallen from 6.53% to 6.13% in the first two weeks of September. Why did they drop so much? Because the bond market was increasingly confident that the Fed would cut interest rates (after the weak August BLS jobs report and huge downward QCEW revisions).
New home sales spiked in August. New home sales jumped to an annualized pace of 800,000 units in August 2025 — the highest figure we’ve seen since January 2022. That was WAY above forecasts, and a 21% increase from the 664,000-unit sales pace experienced in July 2025. Most of the increase came from the South (66% of new home sales in August). Despite this, the median sales price still rose 5% month-over-month to $413,500.
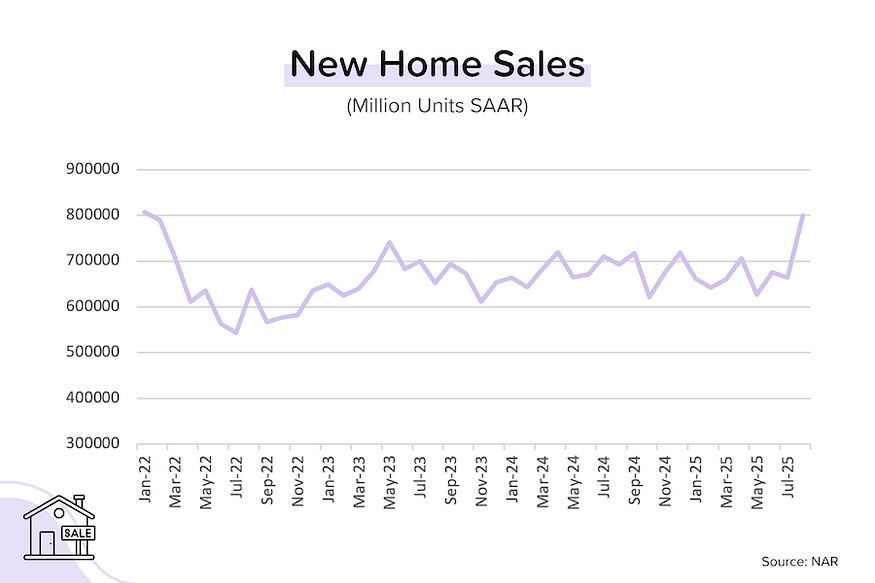
TP: This is a volatile data series, so you have to be careful reading too much into this. We also know (from the NAHB’s confidence index) that builders had ramped up incentives in August to try to clear out completed inventory. At the same time, it’s important to recognize that mortgage rates didn’t drop significantly until September.
Existing home sales still stuck at 4 million. Existing home sales declined -0.2% month-over-month in August to an annualized pace of 4 million units. The median sales price eased 0.7% MoM to $423K. [NAR]
TP: How did new home sales spike, but existing home sales were flattish? Remember that existing home sales (signed contracts) represent buyers who were shopping in June and especially July — when mortgage rates were much higher. We should definitely see an increase in existing home sales when the September numbers come out.
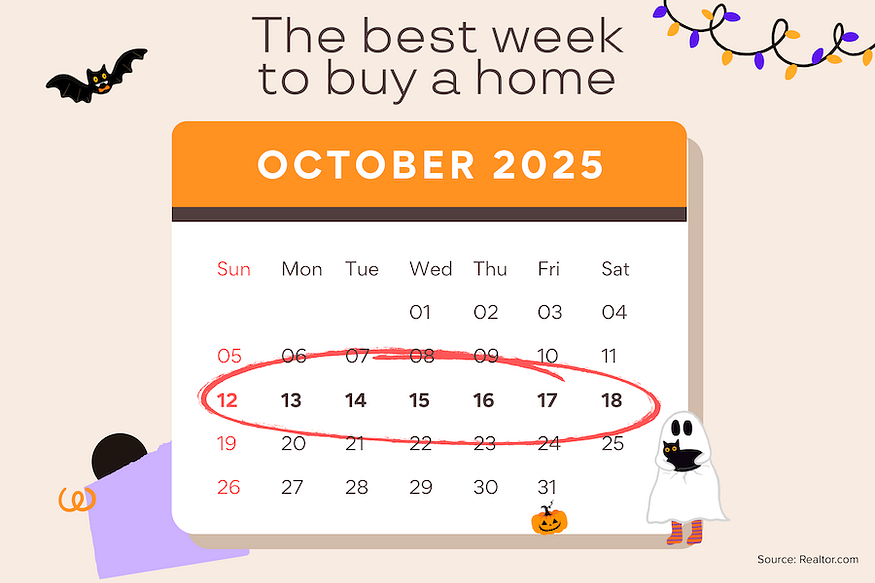
The best time to buy a home is…5 years ago, goes the old real estate joke. But according to analysis from Realtor.com, October 12–18 is (historically) the best week for buyers because it combines high inventory levels with declining buyer demand.
What Jerome Powell said. The Fed Chairman (and a host of other Fed members) gave public addresses this week. Powell’s main message was a refrain from his September 17 press conference: “there is no risk-free path” ahead. In other words, there are upside risks to inflation (tariffs) and downside risks to employment (low/negative jobs growth), and the Fed isn’t sure which will break first.
TP: The market is 94% sure that we’ll get another 25 bps rate cut on October 29, and 77% certain of a third rate cut on December 10.
Bond and Mortgage Market
Average mortgage rates are significantly lower than they were at the start of September, but they’ve given back some of their gains since the Fed meeting. That’s because a number of Fed speakers have suggested that additional rate cuts before year-end are not a done deal.
The August PCE report out on Friday (today) could also be market-moving, but Fed Chair Jerome Powell already gave us a sneak peek (2.7% on “headline” and 2.9% on “core”). If correct (and why shouldn’t they be?) that’s actually lower than expected for the “headline” figure.
Here’s what the market is currently expecting from the final three FOMC meetings of the year:
Note: The Fed Funds Rate policy range (after the 25 bps rate cut this week) is now 4.00–4.25%.
- October 29 FOMC Meeting: 86% probability that rates will be 25 bps below current (was 90% last week). In other words, a second 25 bps rate cut on October 29.
- December 10 FOMC Meeting: 65% probability that rates will be 50 bps below current (down from 82% last week). In other words, a third 25 bps rate cut on December 10.
A Bit of Inspiration
Markets (stocks, bonds, housing) are mean-reverting. Big upswings tend to be followed by big downswings. Eventually, however, markets find their natural equilibrium. In the case of housing, I consider that equilibrium to be existing home sales of between 5.0 to 5.5 million units per year. We were well above that during the pandemic. And we’ve been well below that (4 million units per year) for the last three years.
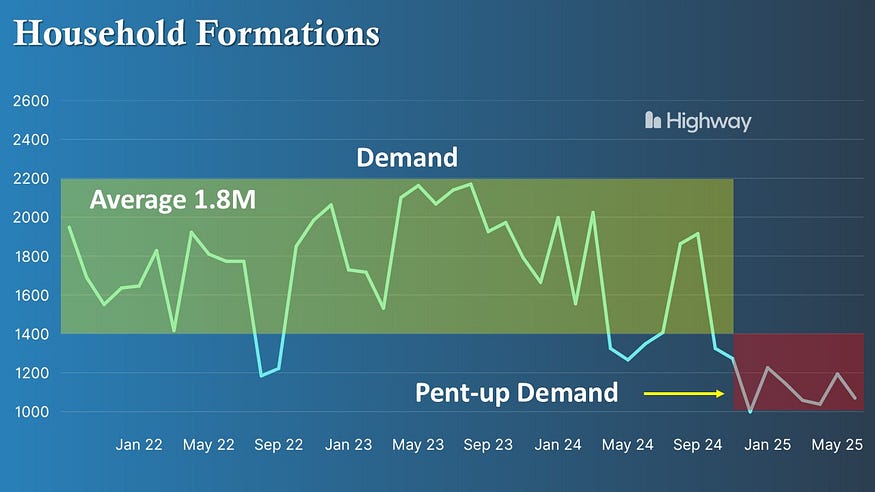
Two charts I want to share with you. The first looks at annual household formation. This is basically people moving out on their own. Over the last few years, household formation has been well below the average of 1.8 million per year. Why? Because buying a home has become much less affordable (higher prices during COVID & higher mortgage rates since 2022). So people are staying in the family home longer.
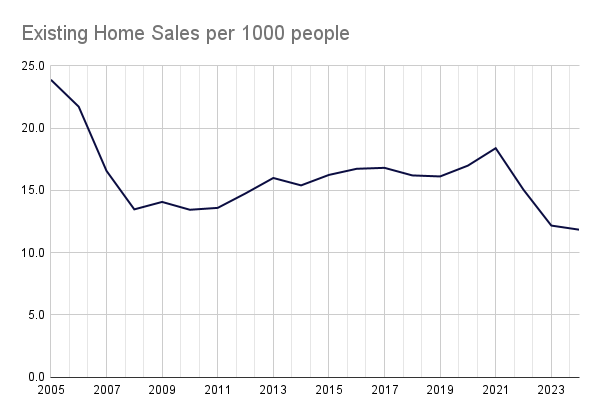
The second looks at the number of existing home sales per 1000 population. As the population of the US grows, we should see a general increase in the number of homes changing hands every year. But over the last few years, this figure has cratered to 11.8. Between 2012–2019, it averaged 16. If we assumed mean reversion and applied that 16 to the current US population, it would imply annual existing home sales of 5.4 million. (That’s how I get my equilibrium transaction volume.)
So take heart! Household formation will rebound and the number of existing home sales per population will mean-revert. That means a lot more transactions. It’s just a question of time.
They Said It
“Home sales have been sluggish over the past few years due to elevated mortgage rates and limited inventory. However, mortgage rates are declining and more inventory is coming to the market, which should boost sales in the coming months.
Record-high housing wealth and a record-high stock market will help current homeowners trade up and benefit the upper end of the market. However, sales of affordable homes are constrained by the lack of inventory.
The Midwest was the best-performing region last month, primarily due to relatively affordable market conditions. The median home price in the Midwest is 22% below the national median price.” — Lawrence Yun, NAR’s Chief Economist
Related posts
.png)
Job Market Slows, Inflation Below Forecasts

.jpg)
Weekend Talking Points - 'Good Data'
.jpg)
The Fed’s Dovish Shift in 2026
Ready to close more deals?
ListReports automatically delivers personalized marketing collateral to your inbox helping you engage with your customers and prospects.